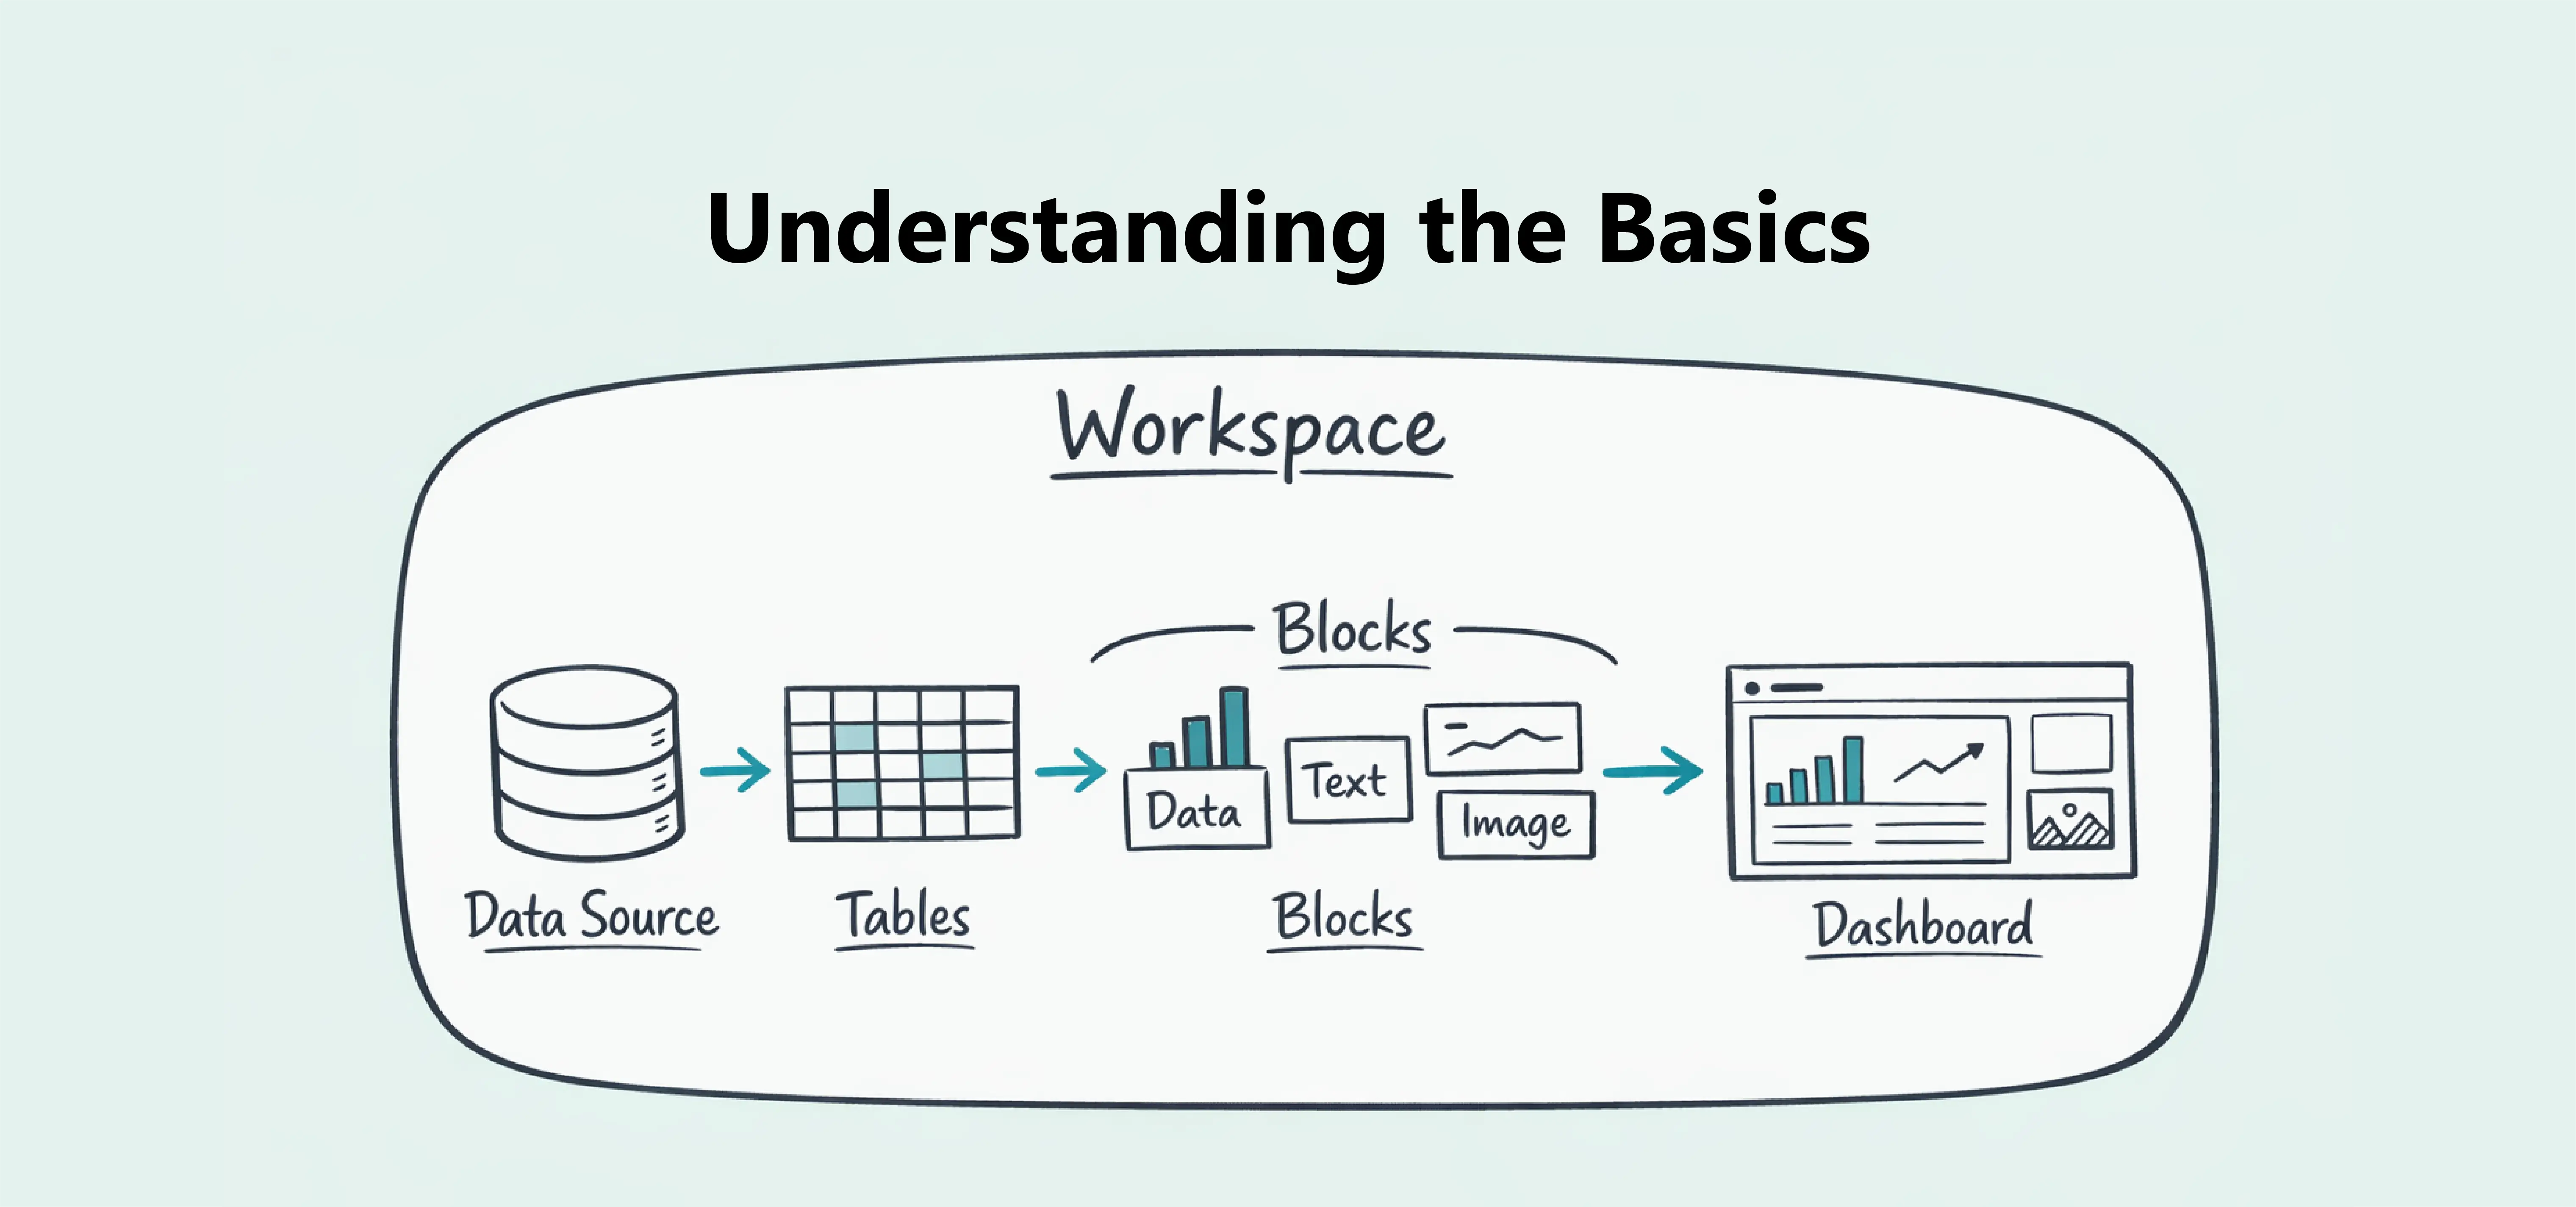
Understanding the Basics
Learn the core concepts of Dashbreeze, including workspaces, data sources, tables, blocks, and how dashboards are built.


Dashbreeze helps you turn your data into clear, interactive dashboards.
Instead of assembling reports in separate spreadsheets or sending static screenshots, you can keep the information your audience needs in one visual, easy-to-share place. Dashbreeze handles the path from raw rows to a finished dashboard, so you can spend more time deciding what the data means.
You can use Dashbreeze to:
Dashbreeze works with two main concepts:
To get started, create a dashboard and add a data block (Chart, Highlight, or Details). Click Select data to connect a source and build your table. When it’s ready, go back to your dashboard, pick the table in your block, and choose how your data should appear.
A simple first dashboard might contain a Highlight for total revenue, a Chart for revenue over time, and a Details block for individual sales. All three blocks can use the same table while answering different questions. You can move and resize them as your report takes shape.
As your dashboard grows, you can customize its appearance, collaborate with your team, and publish it when you're ready to share it.
If you're new to Dashbreeze, focus on building your first dashboard. You'll quickly learn how tables, blocks, and dashboards work together as you use the platform.
You do not need to prepare everything at once. Start with one source, one well-structured table, and one question you want the dashboard to answer. You can add more data, visualizations, filters, and collaborators later without rebuilding your work from scratch.