



Managing Integrations
Add, review, reconnect, and secure your data source integrations.

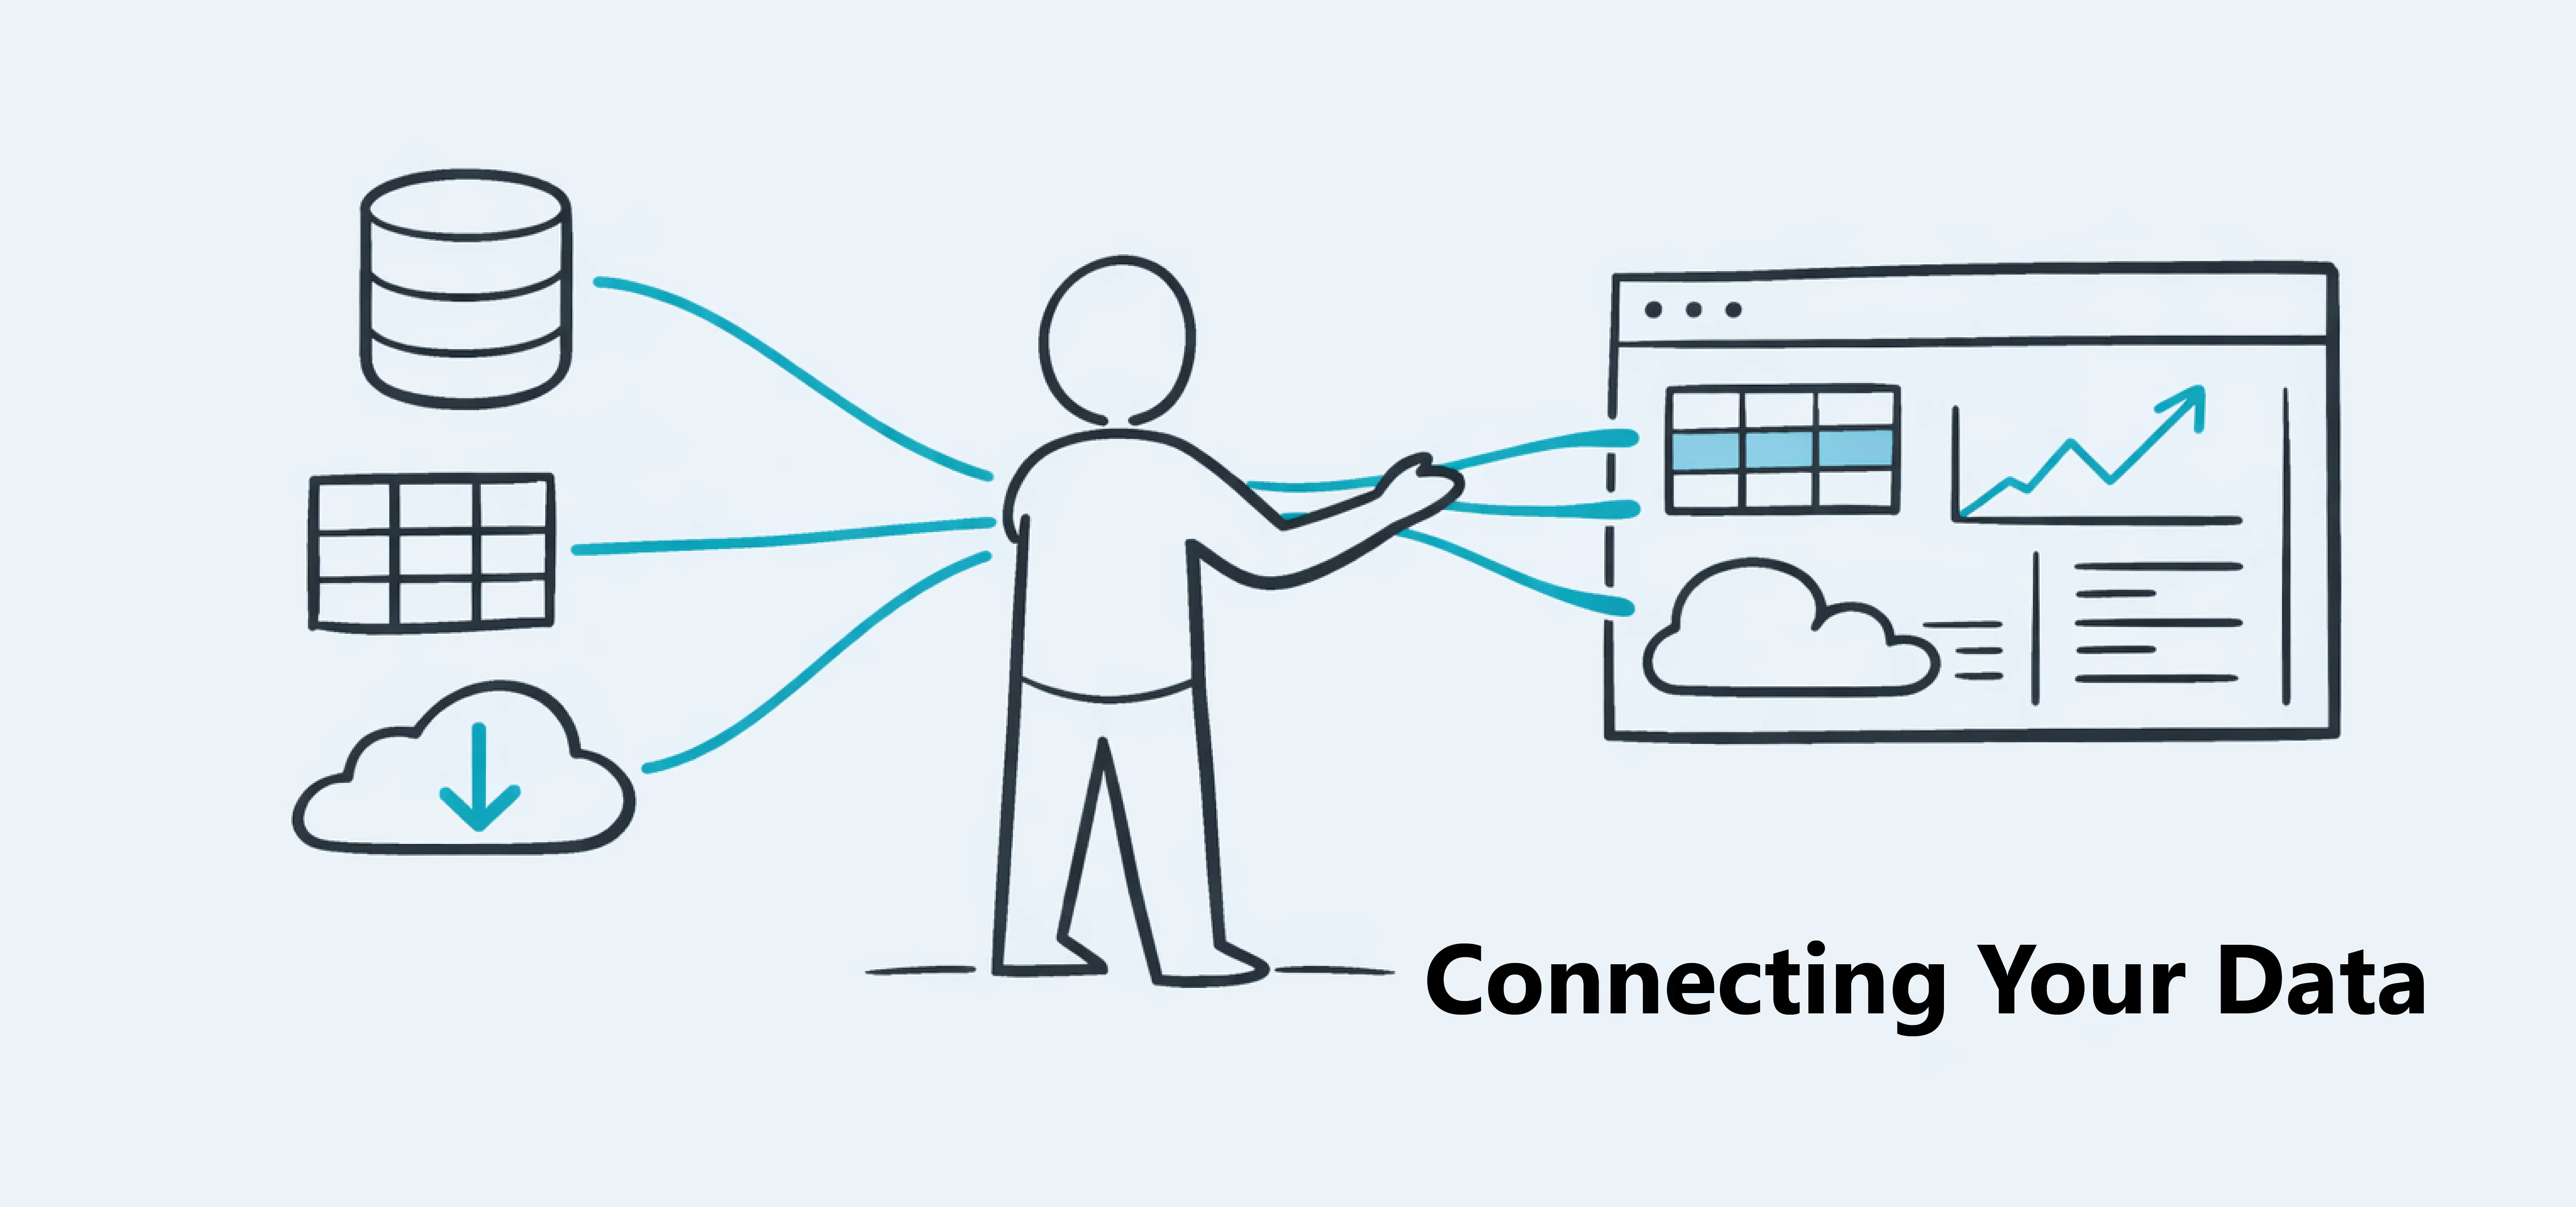
Dashbreeze lets you bring data from external sources so you can use it in dashboards. When your data is imported, it becomes available as tables, which power the data blocks used in your dashboards.
Your source stays unchanged:Dashbreeze only reads and organizes the data needed to build visualizations. It does not edit your original source.
Before connecting a source, decide what question the dashboard should answer and identify the smallest useful dataset. Importing only the relevant sheets, fields, date range, or database table makes the resulting table easier to understand and maintain.
Tables are where your data lives in Dashbreeze. Every data block must connect to a table. You can create a table while setting up your block.
Start by clicking the data block you want to configure. When the settings panel opens on the left, go to the Connect Data section and click Select table, the first setting in the panel.
The table selection screen will open. From there, click Create table. You will then be taken to the page where you can set up your table.
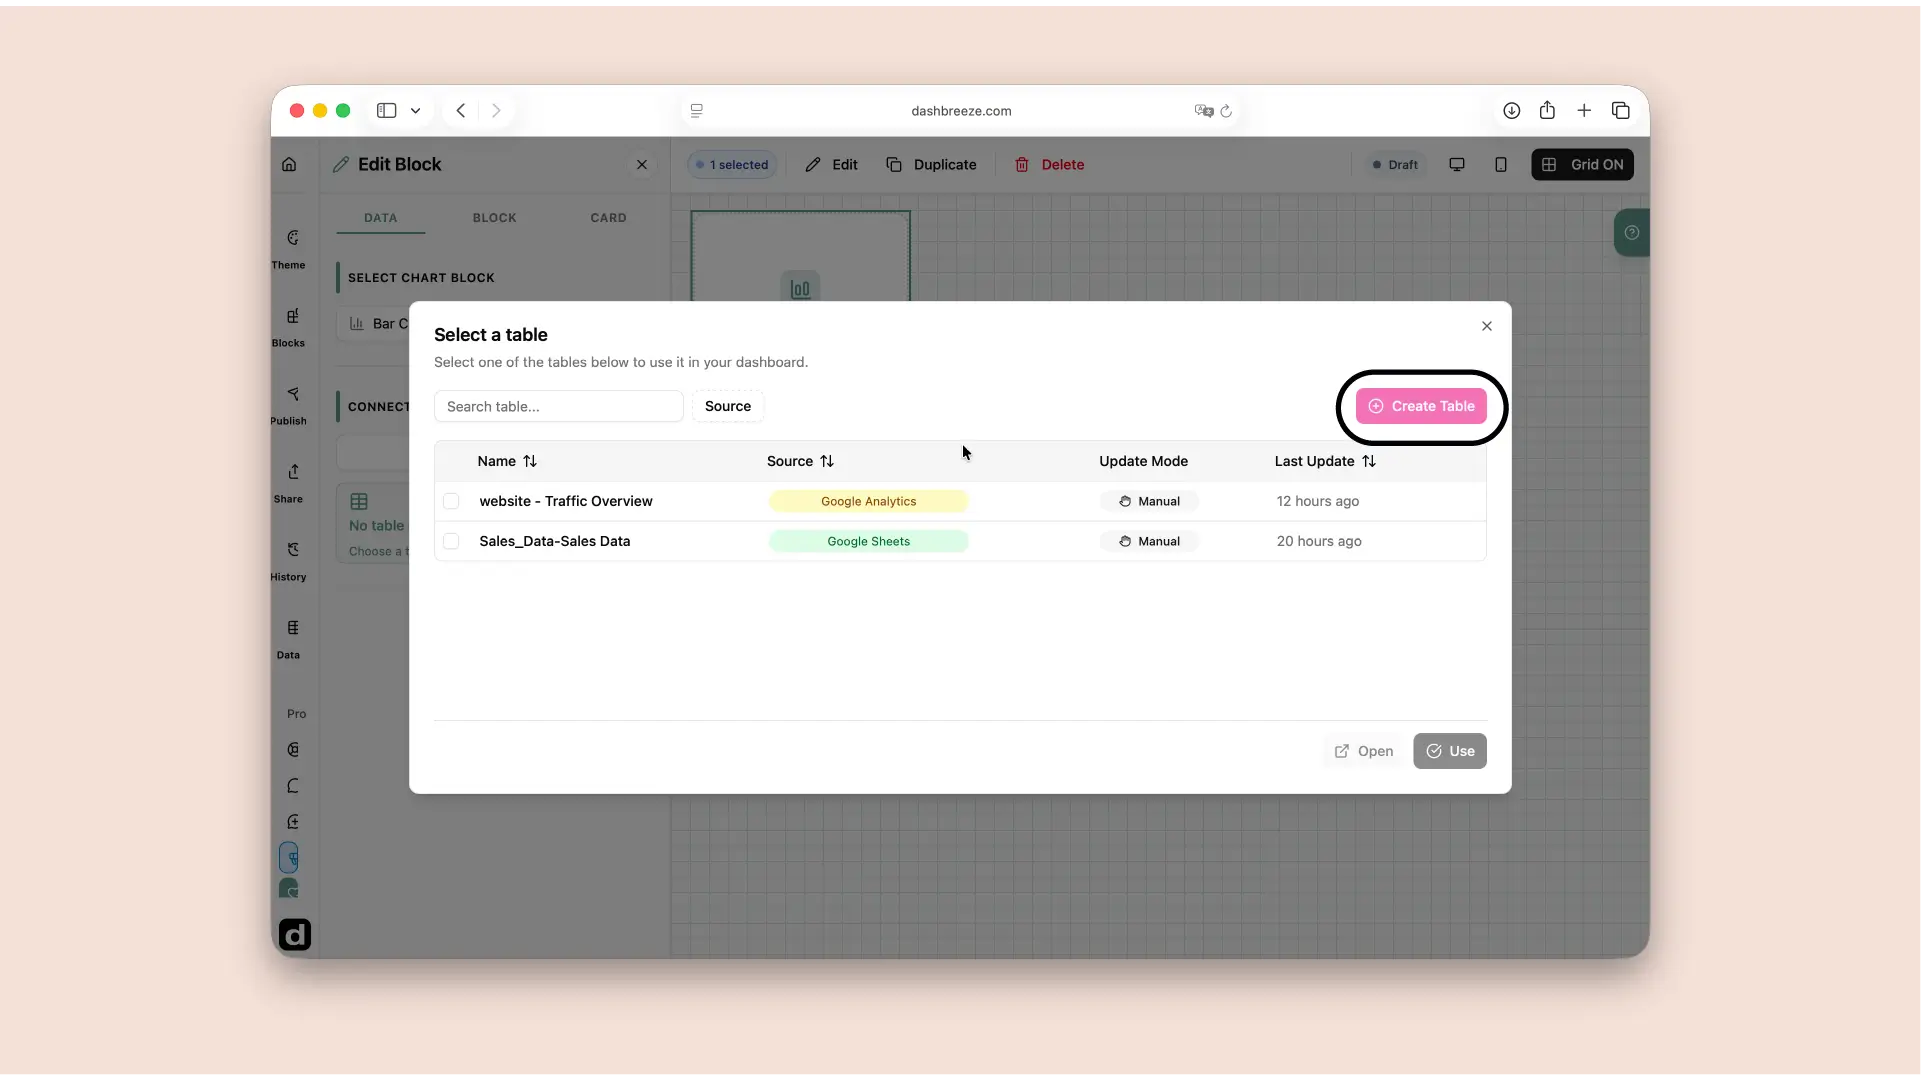
After clicking Create table, the first step is choosing a data source. This is where you select where your data will come from.
Dashbreeze supports several types of data sources, including connected accounts, uploaded files, and databases. A few of the most common:
See all supported data sources
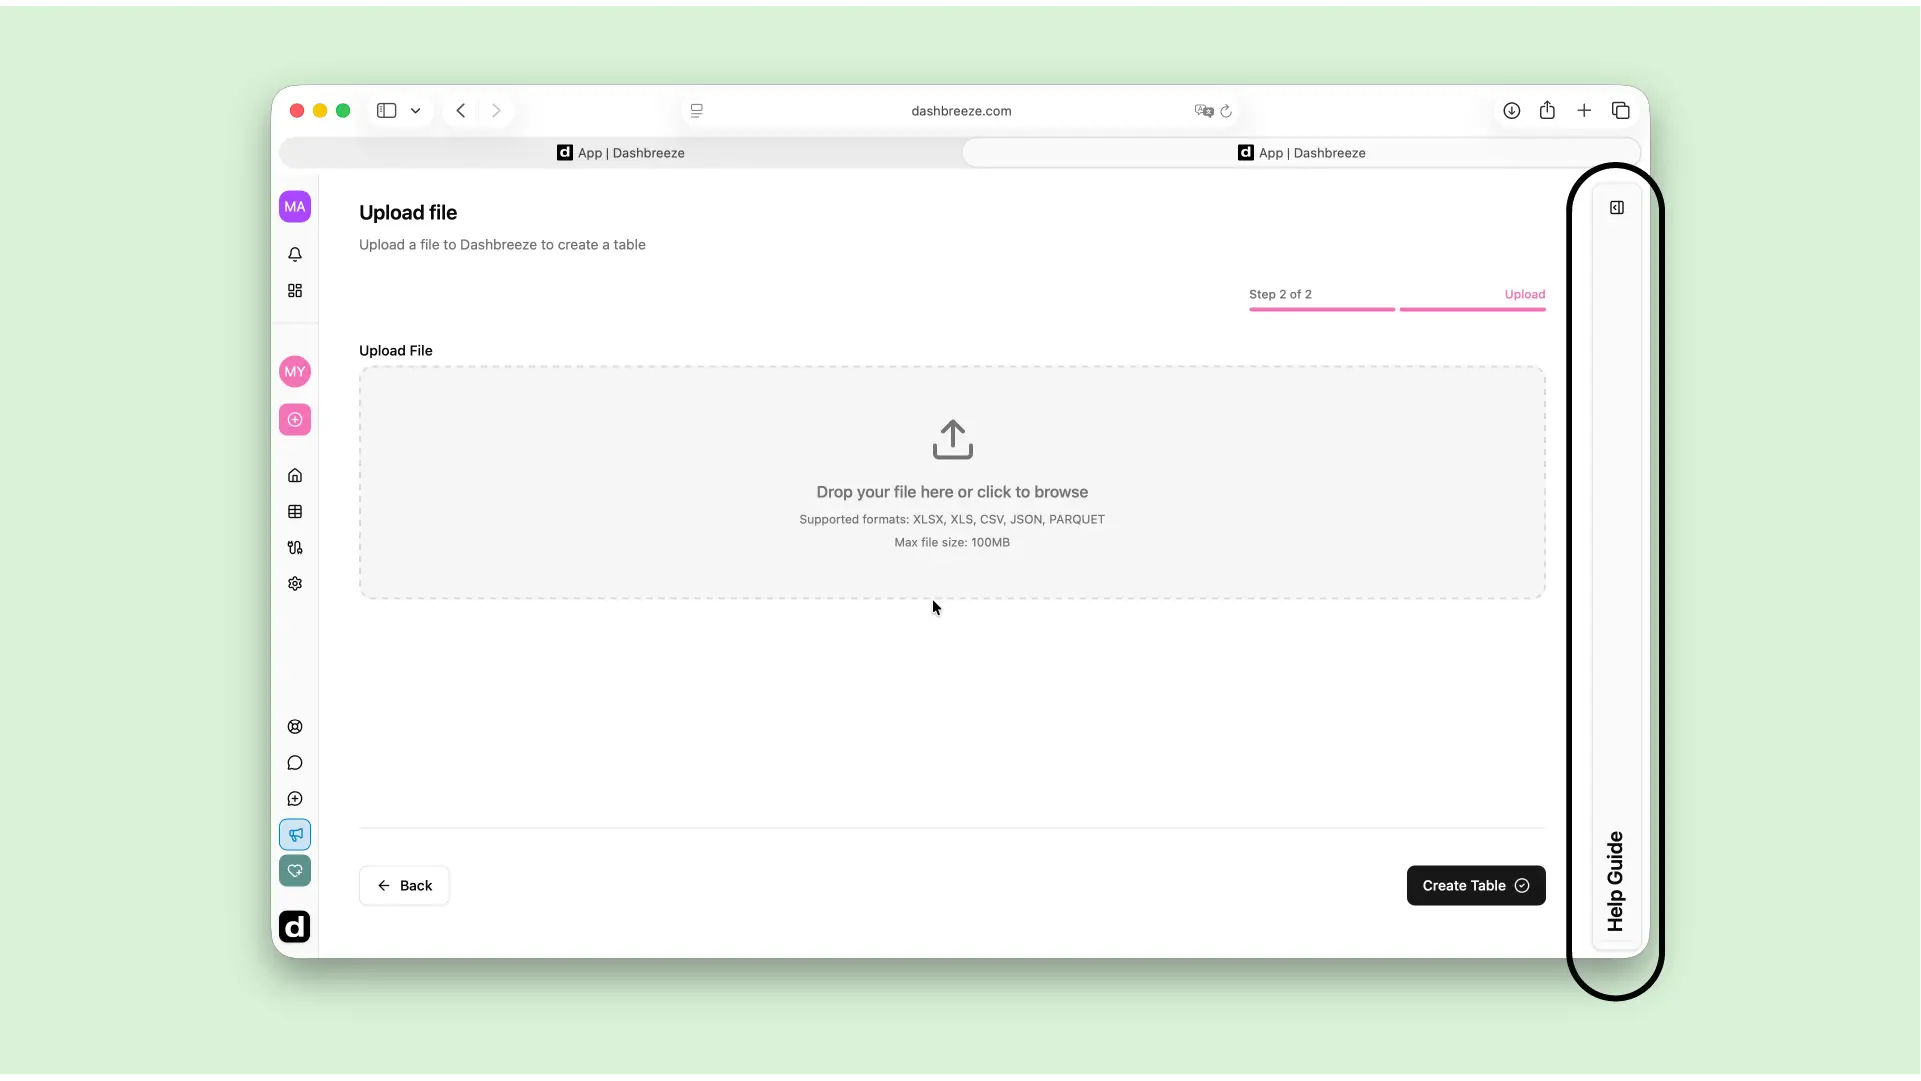
Tip:After selecting your data source, Dashbreeze guides you through the steps to create your table. Each data source includes a step-by-step tutorial available on the right side of the screen. Open the sidebar and follow the instructions to complete the setup.
Row-oriented (can't be used)
| Metric | Jan 3 | Jan 4 | Jan 5 |
|---|---|---|---|
| Revenue | $120 | $45 | $80 |
| Orders | 3 | 1 | 2 |
Column-oriented (recommended)
| Date | Revenue | Orders |
|---|---|---|
| Jan 3 | $120 | 3 |
| Jan 4 | $45 | 1 |
| Jan 5 | $80 | 2 |
Instead of creating a new column for every date, keep all dates in one Date column and add a new row for each record.
After importing a table, you can apply transformations to prepare the data for analysis.
Important:Transformations only change how your data is structured inside Dashbreeze. They never modify your original data source. Your files, spreadsheets, and databases remain unchanged.
Transformations help you clean and organize your data before using it in dashboards.
For example, you can:
To apply a transformation, click the column header in your table. A menu will open where you can select the transformation you want to apply.
These tools help ensure your data is organized and ready to power your dashboard blocks.
After transforming a table, review a few records of the dataset. Check for missing headers, blank values, unexpected date formats, and numbers imported as text. Catching these issues here prevents confusing totals and chart axes later.
After creating your table, you can return to your dashboard and use this data in your blocks.
Go back to your dashboard and click the data block you want to configure. In the settings panel, open the Connect Data section and click Select table.
Choose the table you created from your data source. Then, select the columns from that table that you want to use to build your block.
Each block uses one table as its data source. If you need to use different data, you can create another table and connect it to another block.
One block, one table:A single table can power many blocks, but each individual block connects to one table. Select the table that contains all the columns that block needs.
When you connect a data source such as Google Sheets or Airtable, Dashbreeze creates an integration. This integration securely connects your workspace to that source.
You only need to connect a source once. After the integration is created, you can create additional tables from the same source without reconnecting it.
To manage your integrations, go to the Home page and click Integrations in the left sidebar. There you can rename an integration, reconnect it if needed, or delete it.
Check the integration first:If tables stop refreshing, reconnect an expired integration before recreating them. Delete an integration only when you are certain its connected tables are no longer needed.
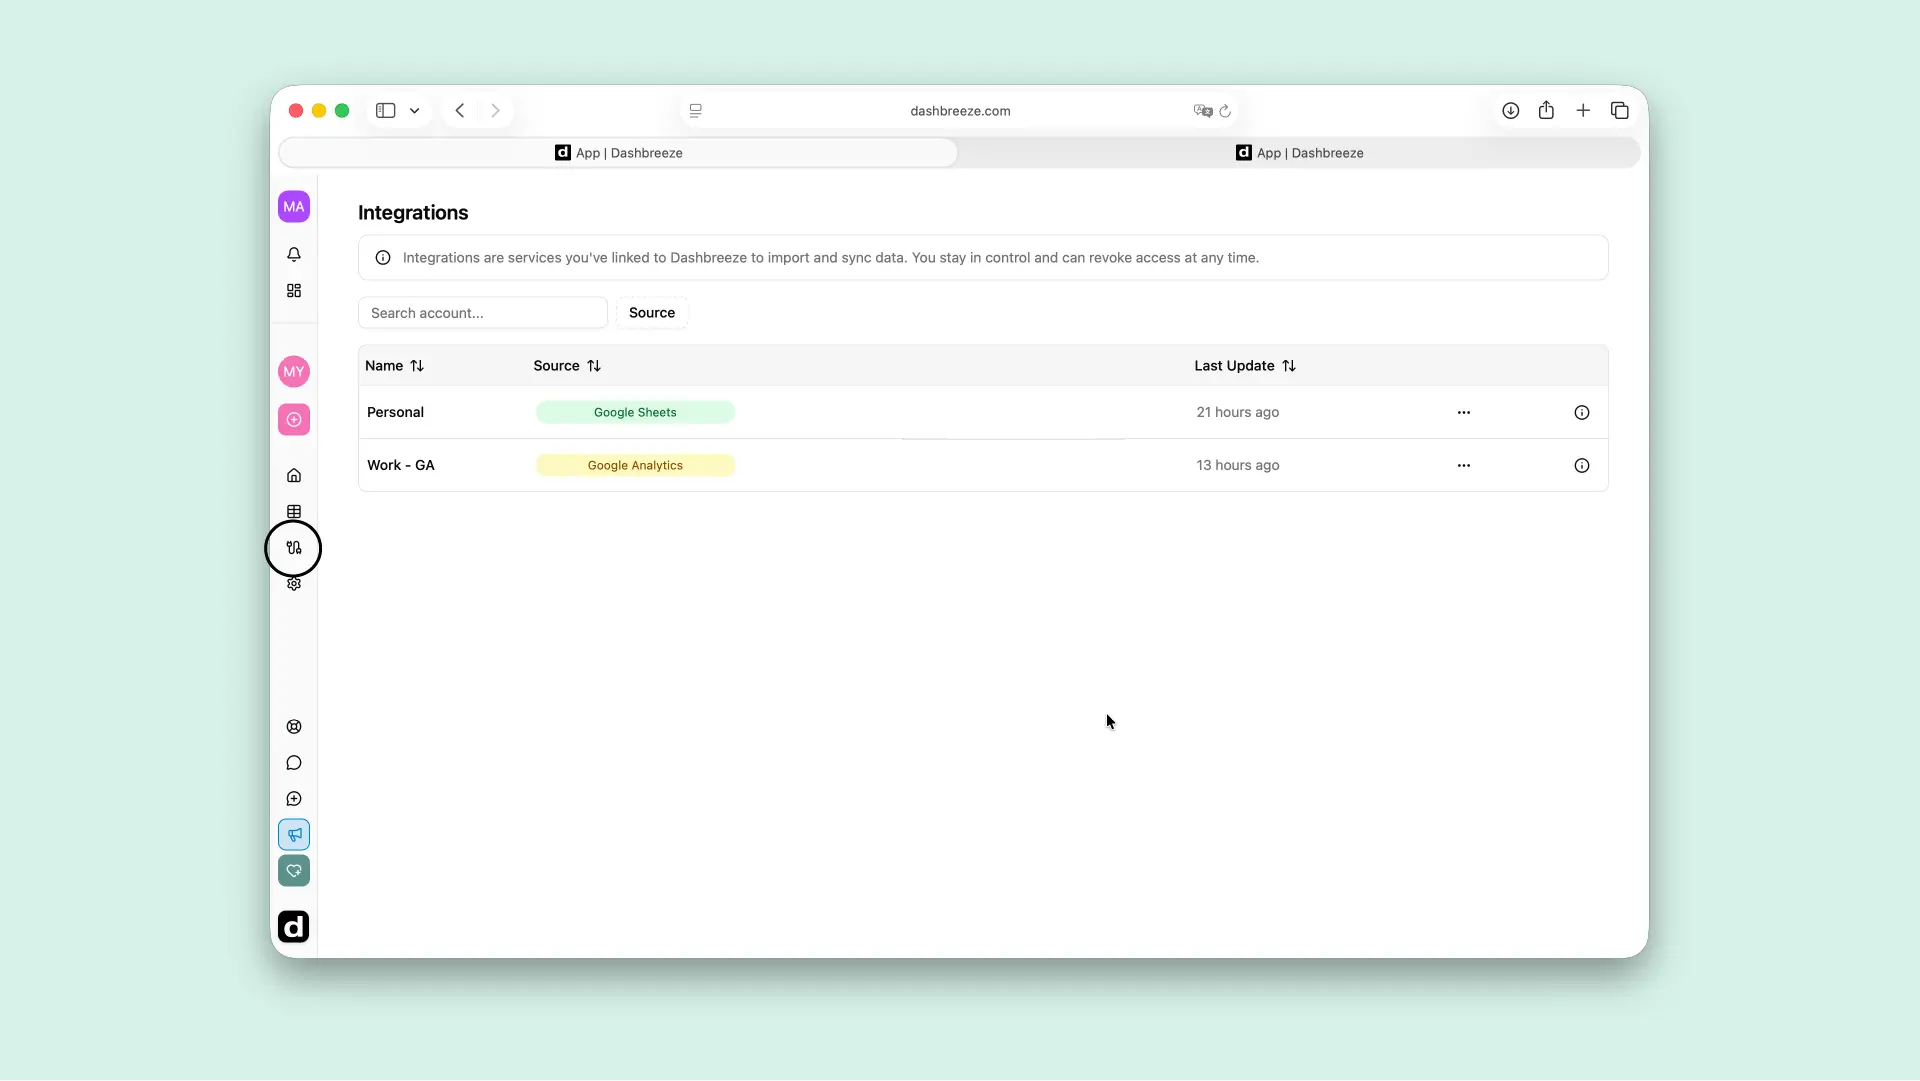
Need to review, reconnect, or remove a connection? Read the complete guide to managing integrations.