

Creating a Dashboard
Create and manage a dashboard, connect blocks to data, and understand Draft, Published, and Unpublished Changes.

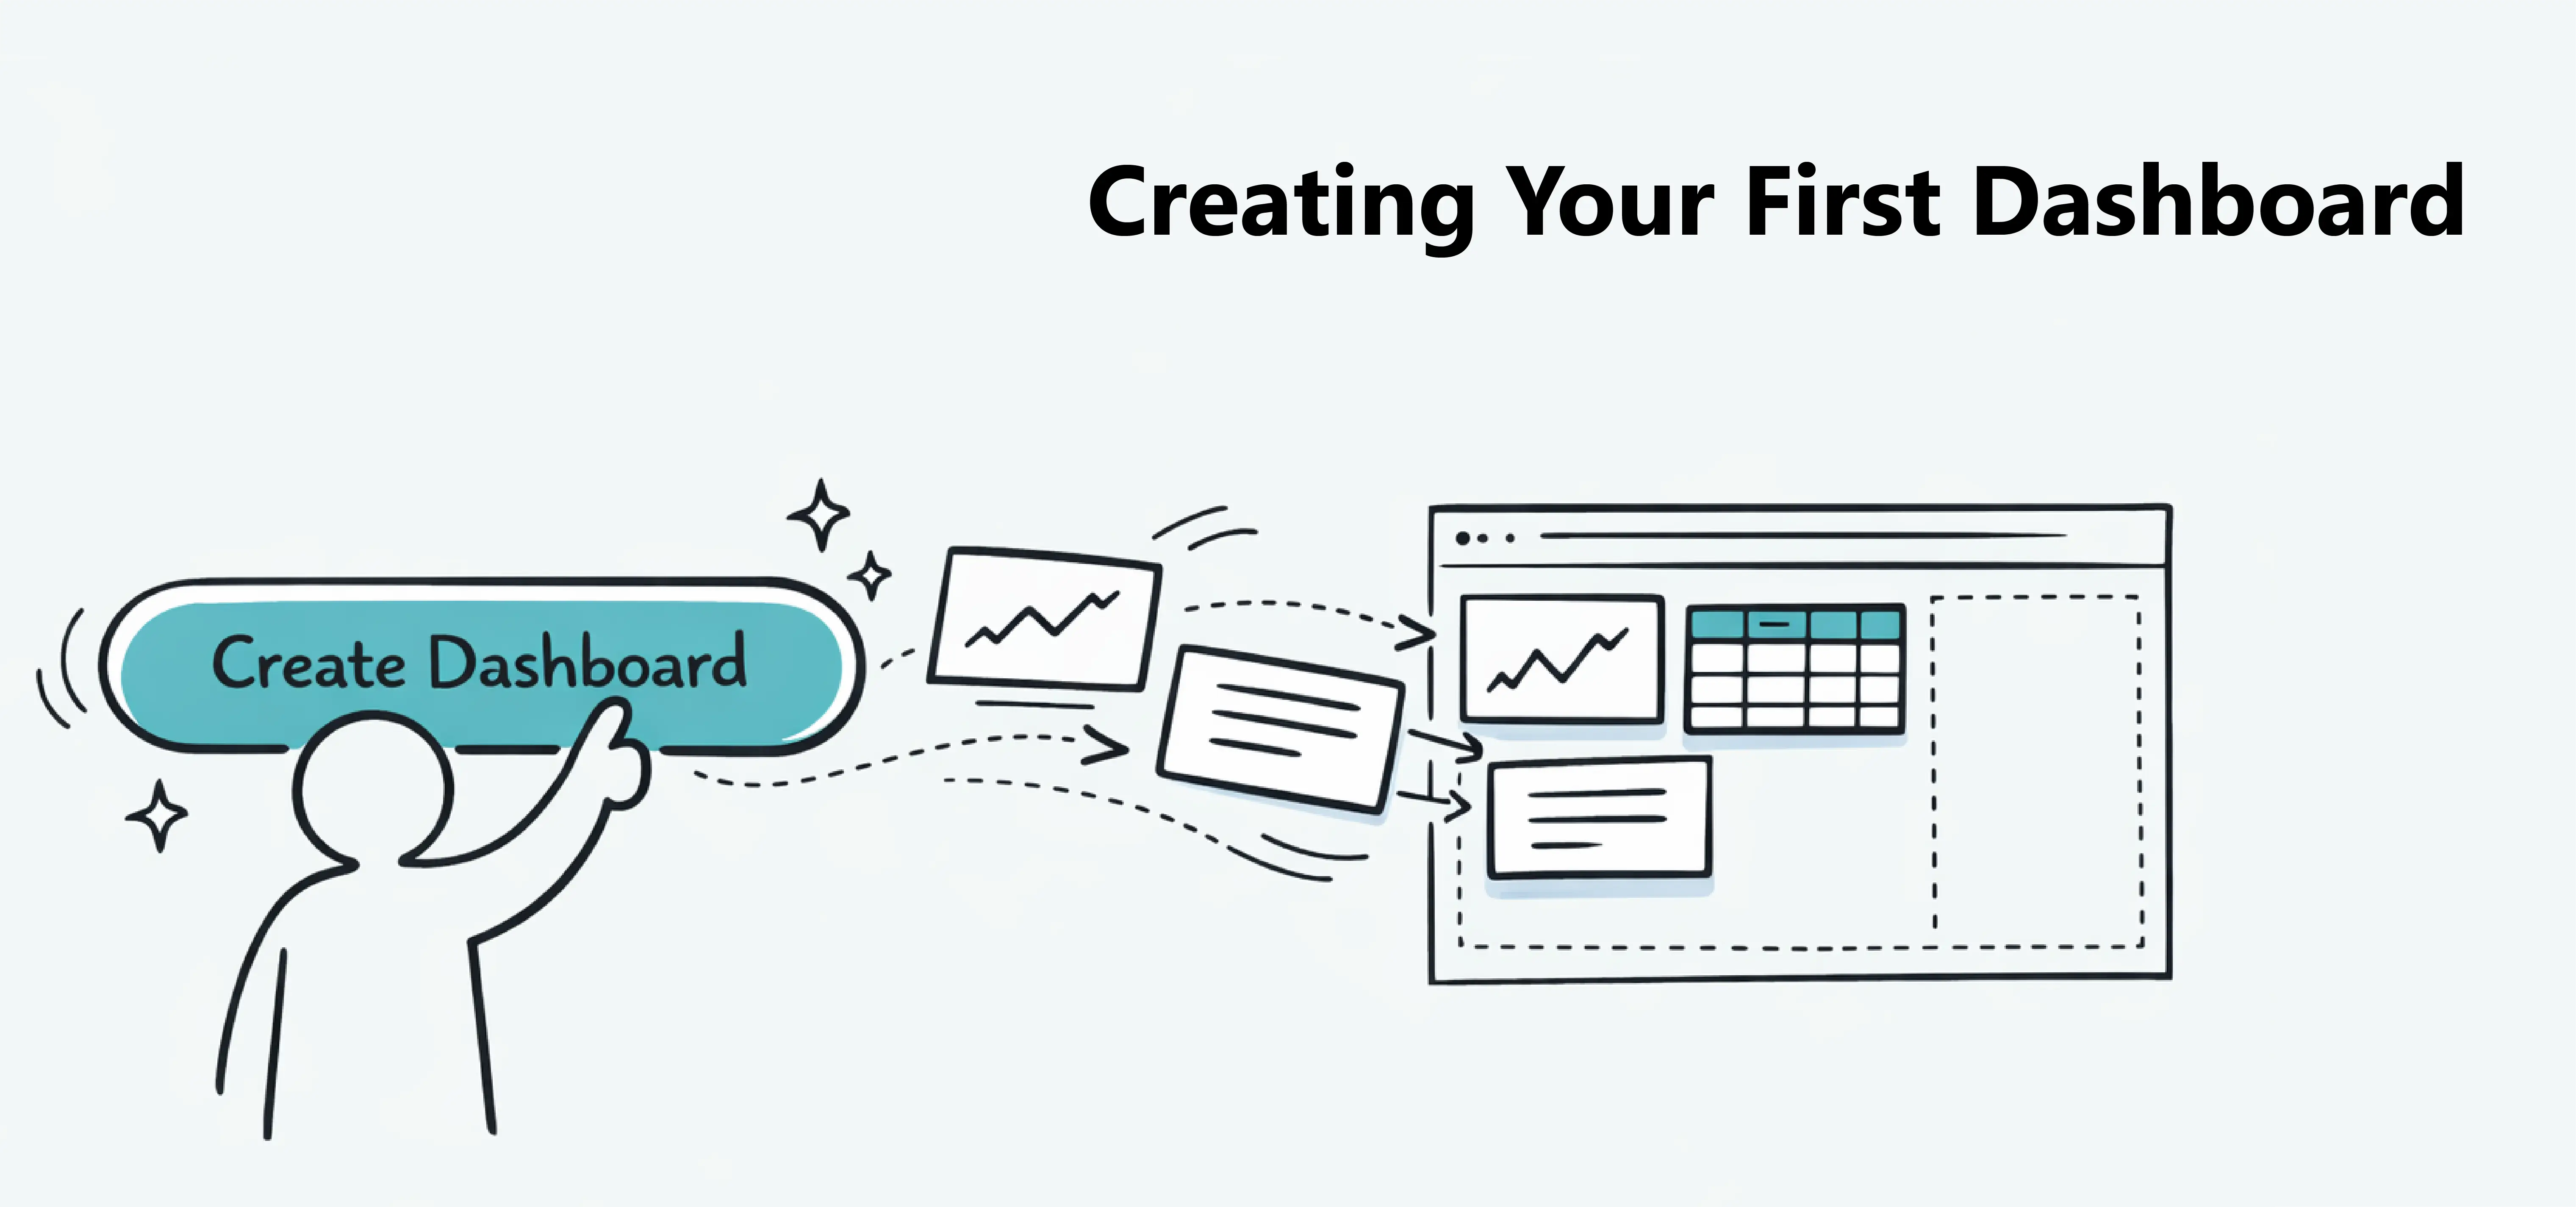
Creating your first dashboard is the easiest way to see how Dashbreeze works. In a few steps, you can start turning your data into visual insights.
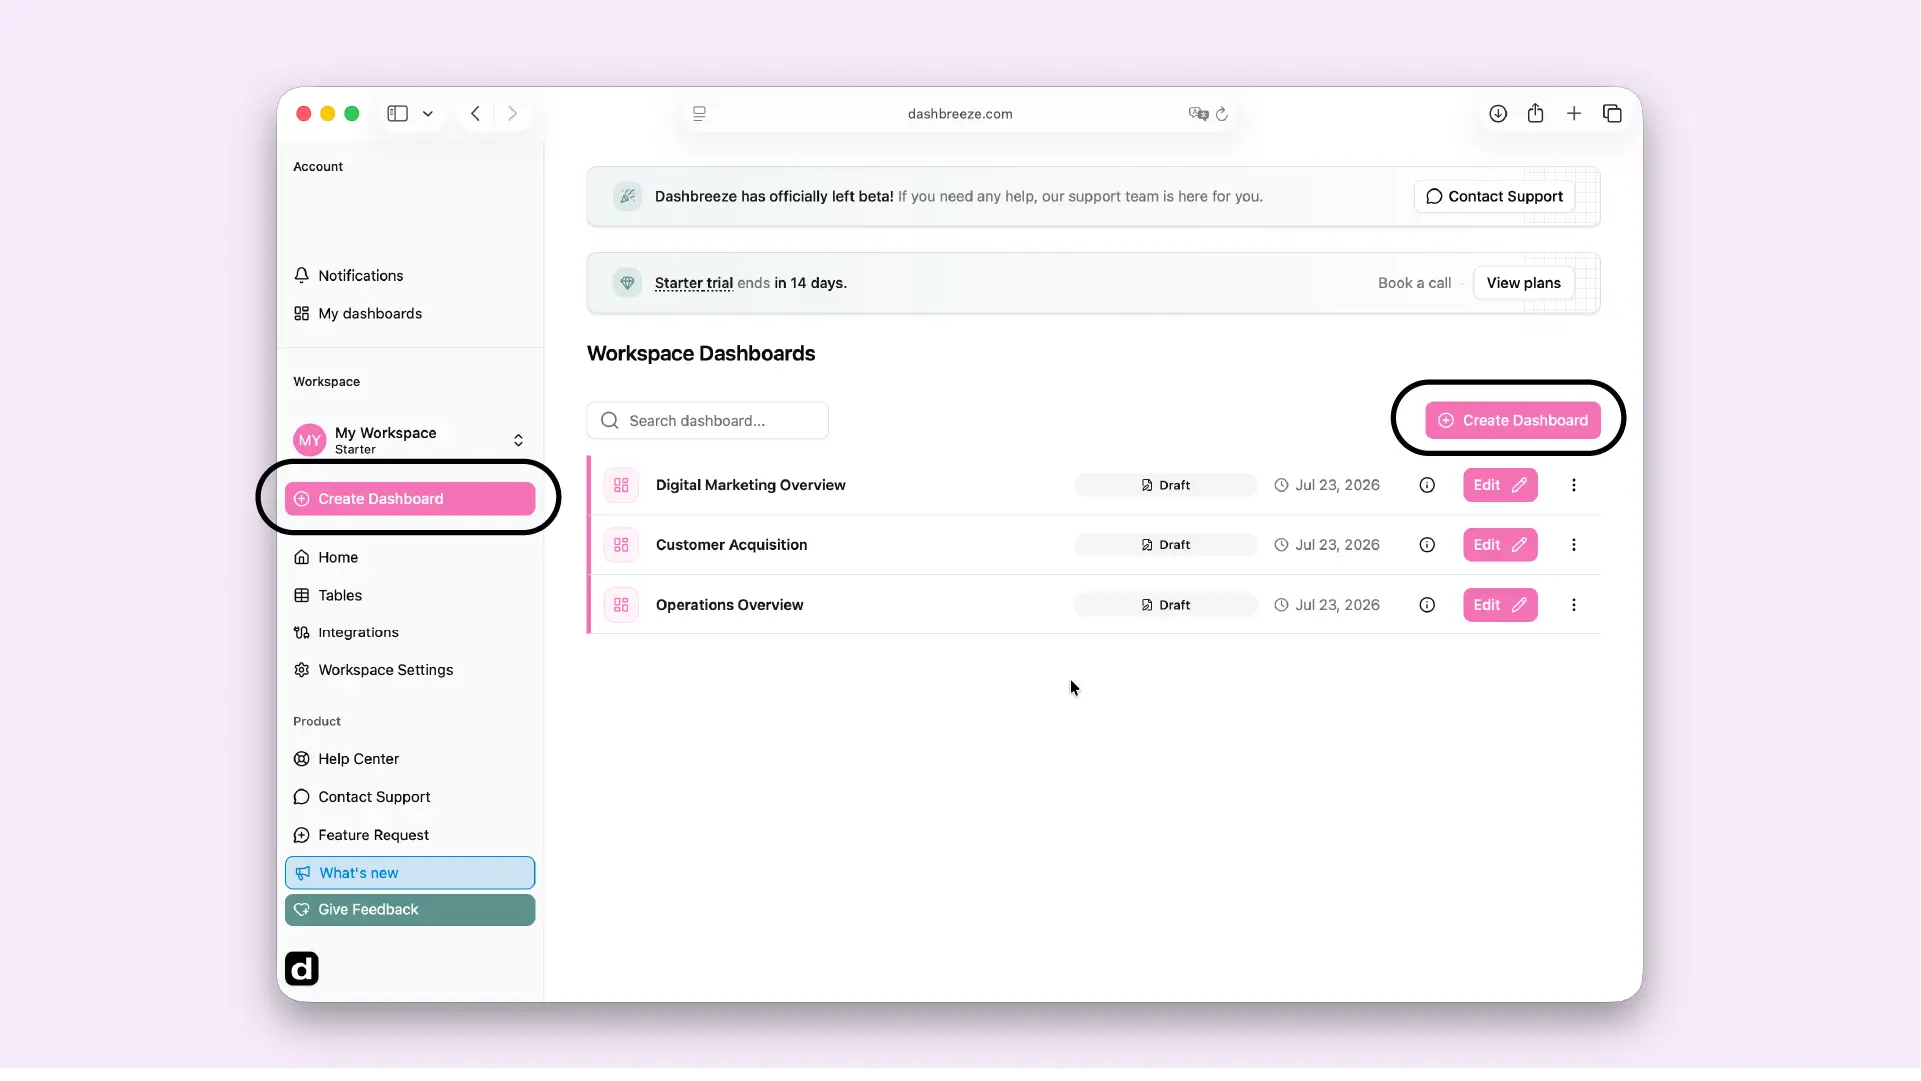
Click the Create Dashboard button on the home page.
You will see an empty canvas where you can start adding blocks to display your data.
Give the dashboard a name that tells other workspace members what it covers.
Open the Blocks panel in the left sidebar and select a data block.
Data blocks are available in three categories:
Charts
Reveal trends, compare categories, and make patterns easier to see.
Best for change & comparison
Highlights
Bring attention to an important KPI, total, trend, or goal.
Best for headline numbers
Details
Display the rows and columns behind your summary and charts.
Best for individual records
Choose the data block you want and add it to your dashboard.
Start with the most important result. Use a Highlight for a single headline number, a Chart when change or comparison matters, and a Details block when readers need to inspect individual records. You can add text and media blocks afterward to provide context.
A simple first layout:Place a Highlight at the top for the headline number, a Chart below it for context over time, and a Details block last for readers who want to inspect individual records.
Data blocks need a table to display information.
Click the block to open its settings, then click Select Table.
Choose an existing table from your workspace, or create a new one if you haven't imported your data yet. We'll explain how to create tables in the next lesson.
After selecting a table, choose the columns the block needs. For example, a revenue-over-time chart usually needs a date column and a numeric revenue column. If the result looks wrong, check the column types in the table and confirm that the block is using the intended fields.
If the result looks wrong:Check that the block uses the intended table and columns. Then confirm that date fields are stored as dates and values you want to calculate are stored as numbers.
Repeat the process to add supporting blocks, then drag and resize them to create a clear reading order. Put headline metrics first, trends and comparisons next, and detailed records last. Preview the dashboard at different sizes before sharing it.
Want a more detailed walkthrough? Check out the complete guide to creating and managing dashboards, configuring blocks, using display mode, and publishing your changes.