
Applying a Theme
Apply a ready-made theme or customize colors, fonts, chart styles, and cards across your dashboard.

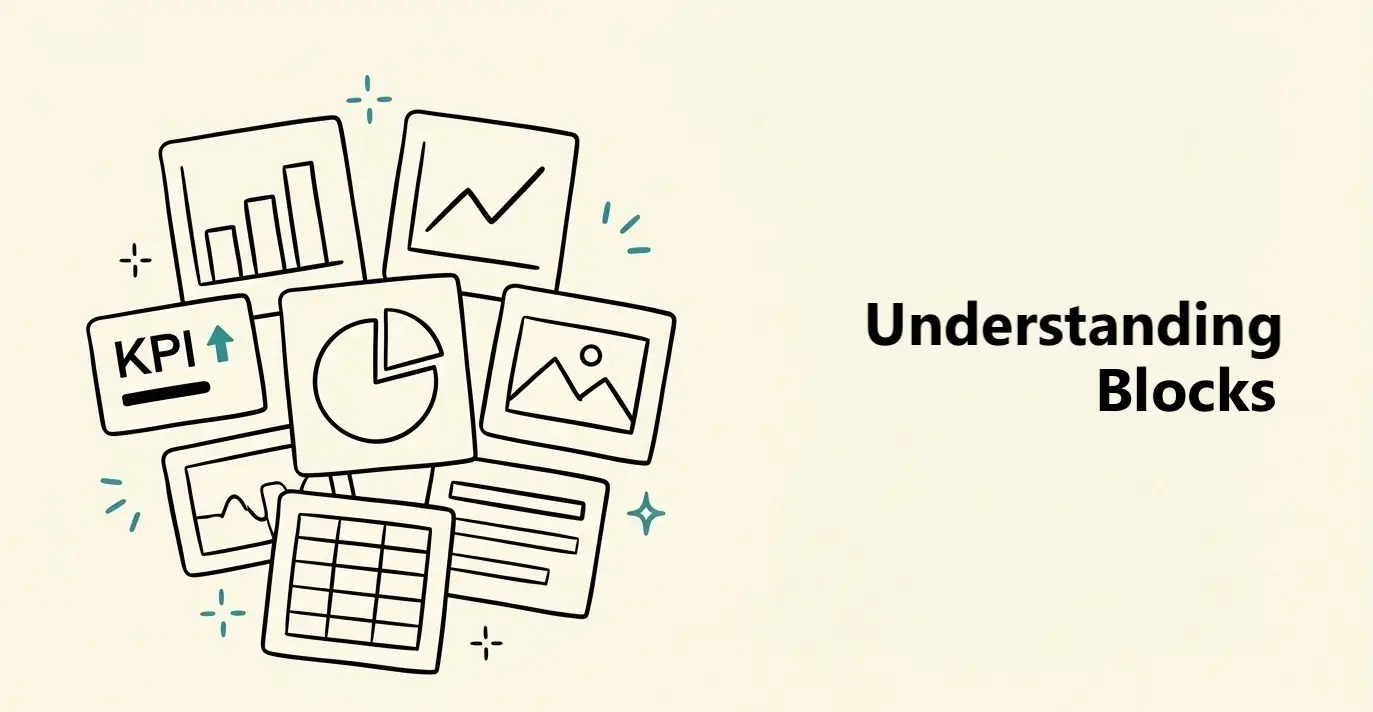
Blocks are the parts you place on a dashboard. A block can show data, such as a chart or KPI. It can also add content, such as text or an image. You can move, resize, and edit each block on its own.
To choose a block, ask one question: do you want to show data or add content?
Data blocks
Turn a table into a chart, number, table, or filter.
Content blocks
Add text, images, or content from another website.
A quick example:Use a KPI block to show total sales, a Line Chart to show how sales changed, and a Text block to explain what the numbers mean.
Data blocks read information from a table. Choose one based on the question you want the dashboard to answer.
Charts
Use charts to compare values, show change, or find patterns.
Highlights
Use highlights when one number or goal matters most.
Details & controls
Show the records behind the summary or let viewers narrow the data.
Good to know:You can connect the same table to many blocks. You do not need to import the data again for every chart or KPI.
Content blocks do not read data from a table. Use them to make the dashboard easier to understand or to add supporting content.
Typography
Text
Add titles, instructions, and explanations.
Media
Image
Add a logo, photo, or other visual.
Add-ons
Embed
Show content from another website or tool.
About embeds:Some websites do not allow their content to be embedded. If a link does not appear, the website may block embeds.
Select a data block to open Edit Block. Then work from left to right:
Connect your data
Choose the table and information this block will use. Add filters if you only want to show part of the results.
Choose how it appears
Change how the information looks, including its colors and style. You can also choose which visual elements are shown on the block.
Style the card
Customize the space around the information. Add a title, description, footer, or icon, and choose the card's background and style.
Make charts fit your dashboard
In the Block tab, most charts let you start with one of five visual styles:
You can then choose the chart colors and font, and decide whether helpful details such as the legend, axes, or grid lines appear. The options change to match the chart type, and you can see each change on the dashboard as you make it.
Your table stays safe:Changing a block only changes that block. It does not edit or delete data in the original table.
Turn on Grid in the top-right corner to make it easier to place and line up blocks on the screen. The grid is only an editing tool. It does not appear on the published dashboard, and dashboard viewers never see it.