
Data Block: Bar Chart
Compare categories with vertical, horizontal, grouped, or stacked bars.

Use the Data panel to see which tables power the current dashboard. From one place, you can check their columns, see how many blocks use each table, and open the table to work with its data.
A quick view of your dashboard data:The Data panel does not change a block's data or filters. It gives you an overview of the table connections that already exist on the dashboard.
Open the dashboard in edit mode, then click Data in the left sidebar. The panel automatically lists every table connected to one or more blocks on this dashboard.
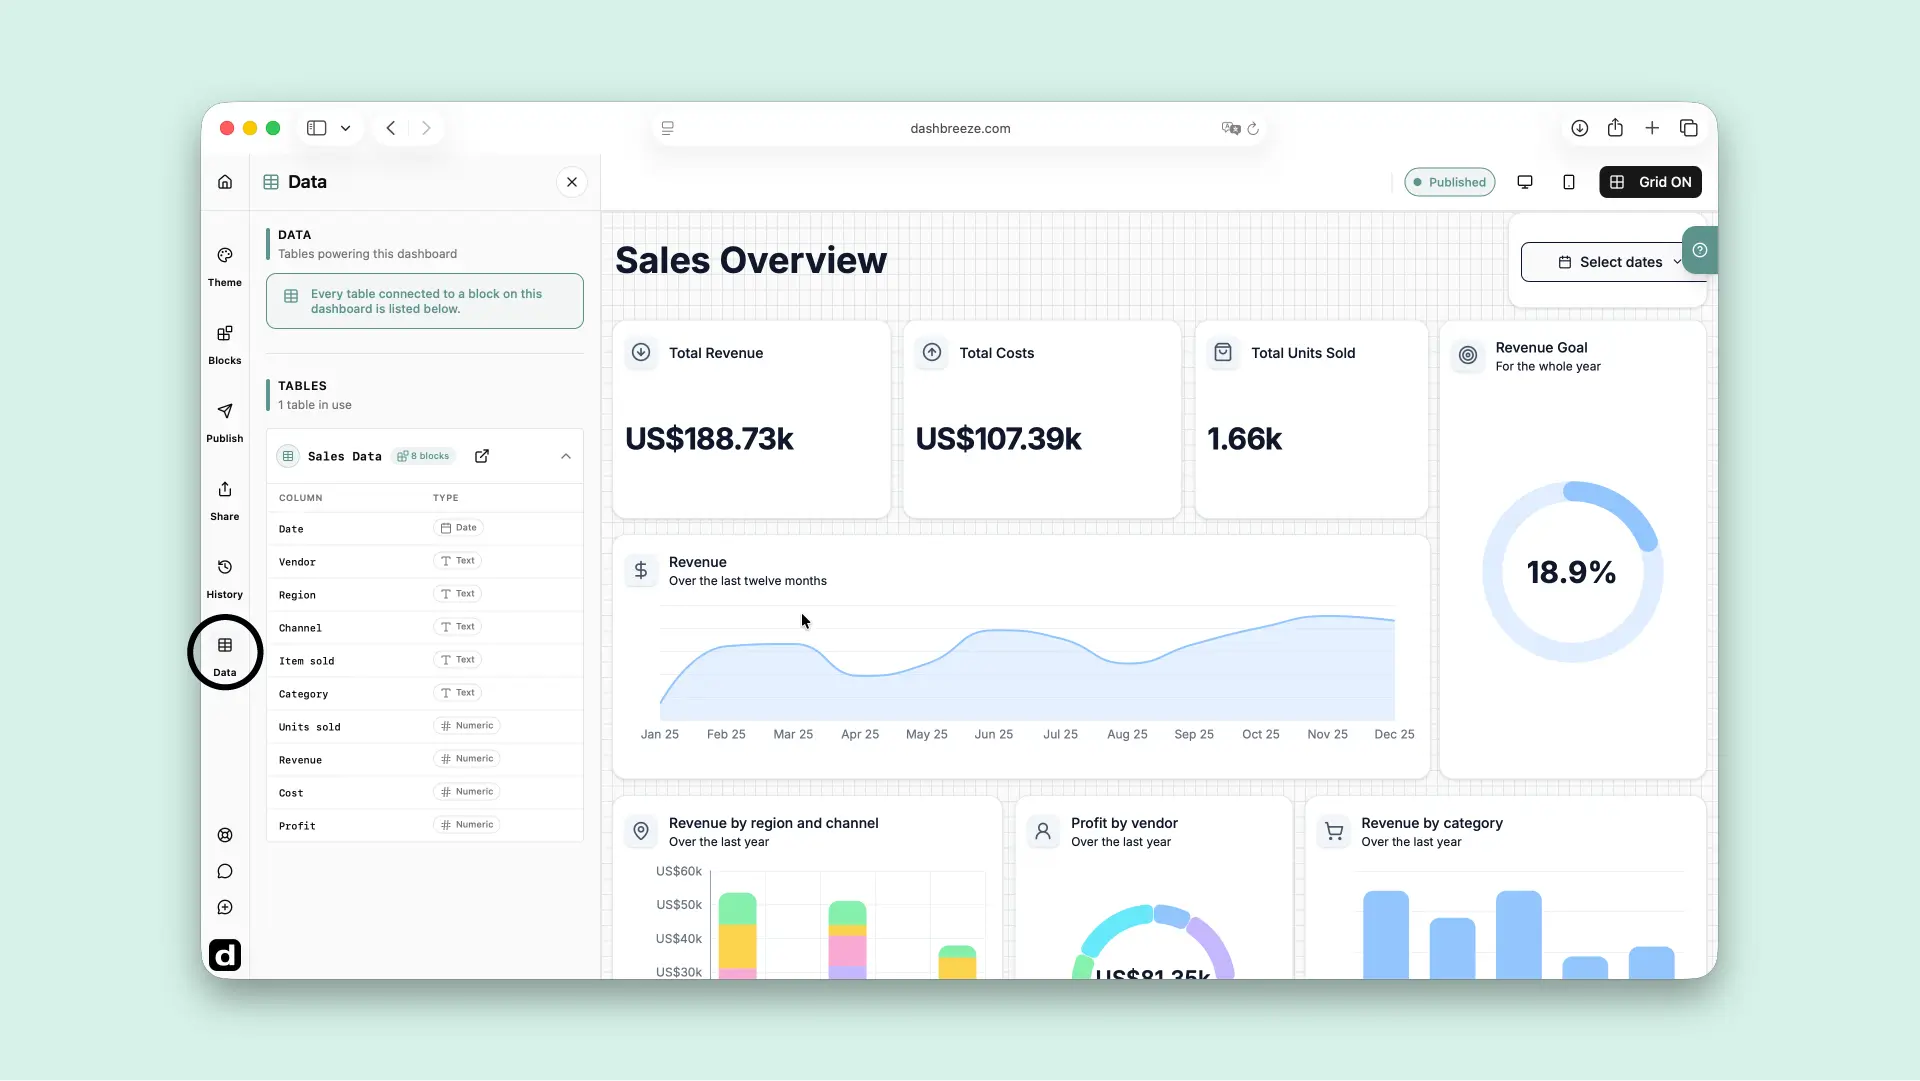
Each table appears once, even when several dashboard blocks use it. Its row gives you the following information and actions:
Table name
Identifies the table connected to your blocks. Click the row to expand or close its column list.
Blocks using it
Shows how many blocks on this dashboard use the table, such as “3 blocks.”
Columns and types
The expanded table shows each available column and whether its data type is Text, Numeric, or Date.
Open table
Opens the table in a new browser tab so you can inspect its data and work with the table without leaving the dashboard editor.
Connections are made in the block settings, not in the Data panel:
Why is the Data panel empty?:No dashboard block is connected to a table yet. Connect a table to a data block and it will automatically appear here.