
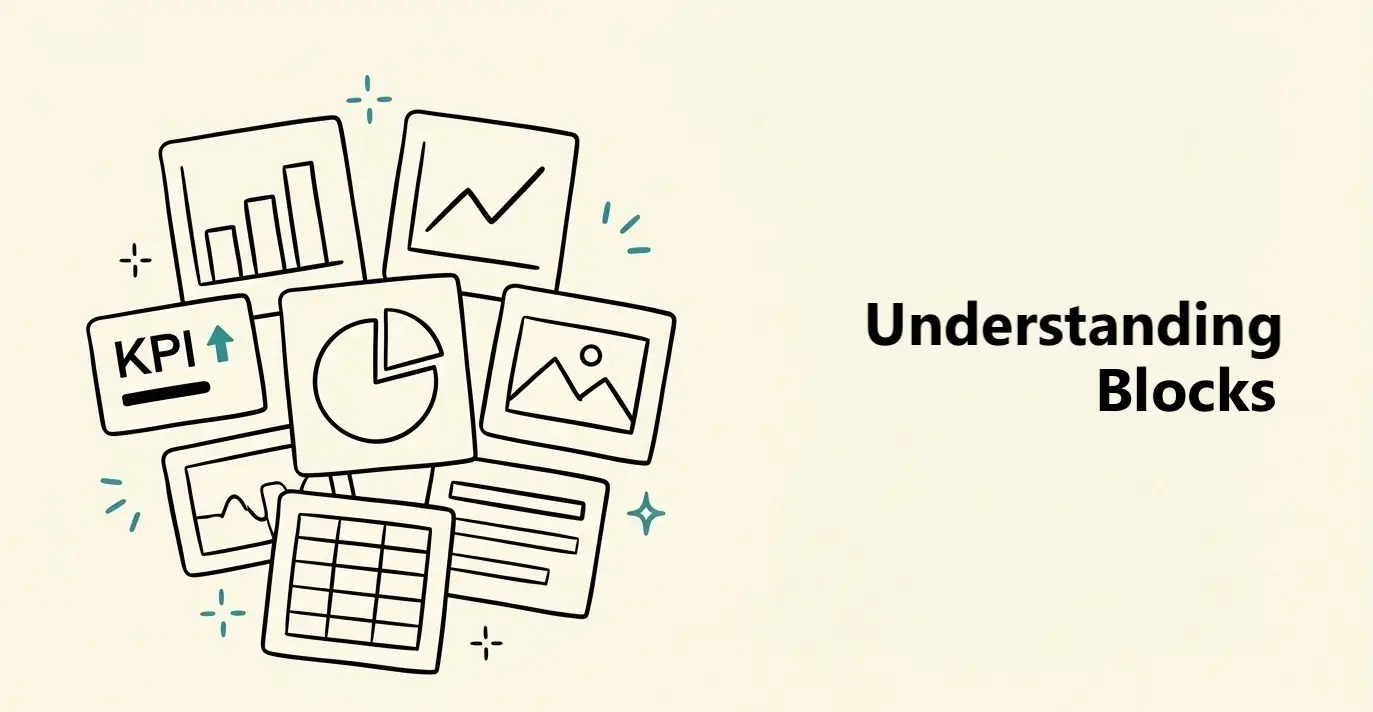
Understanding Blocks
Choose the right data or content block, add it to your dashboard, and use its Data, Block, and Card settings.

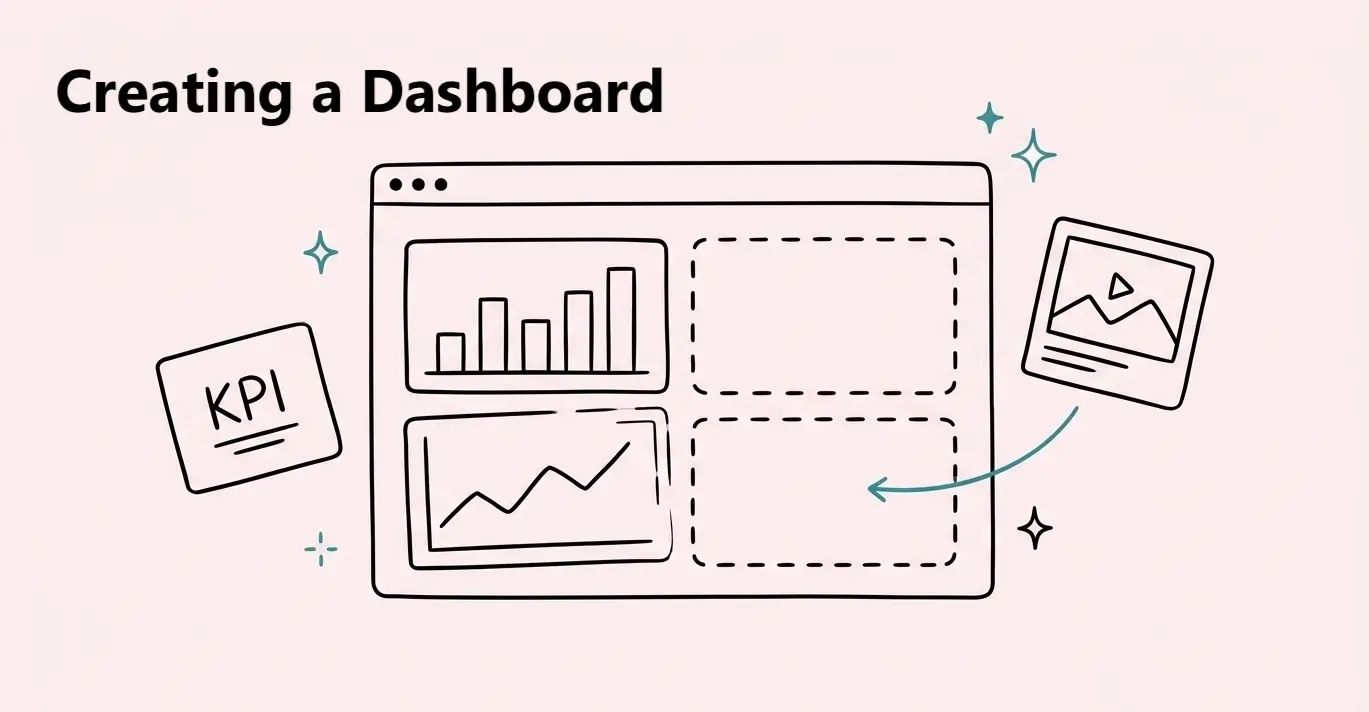
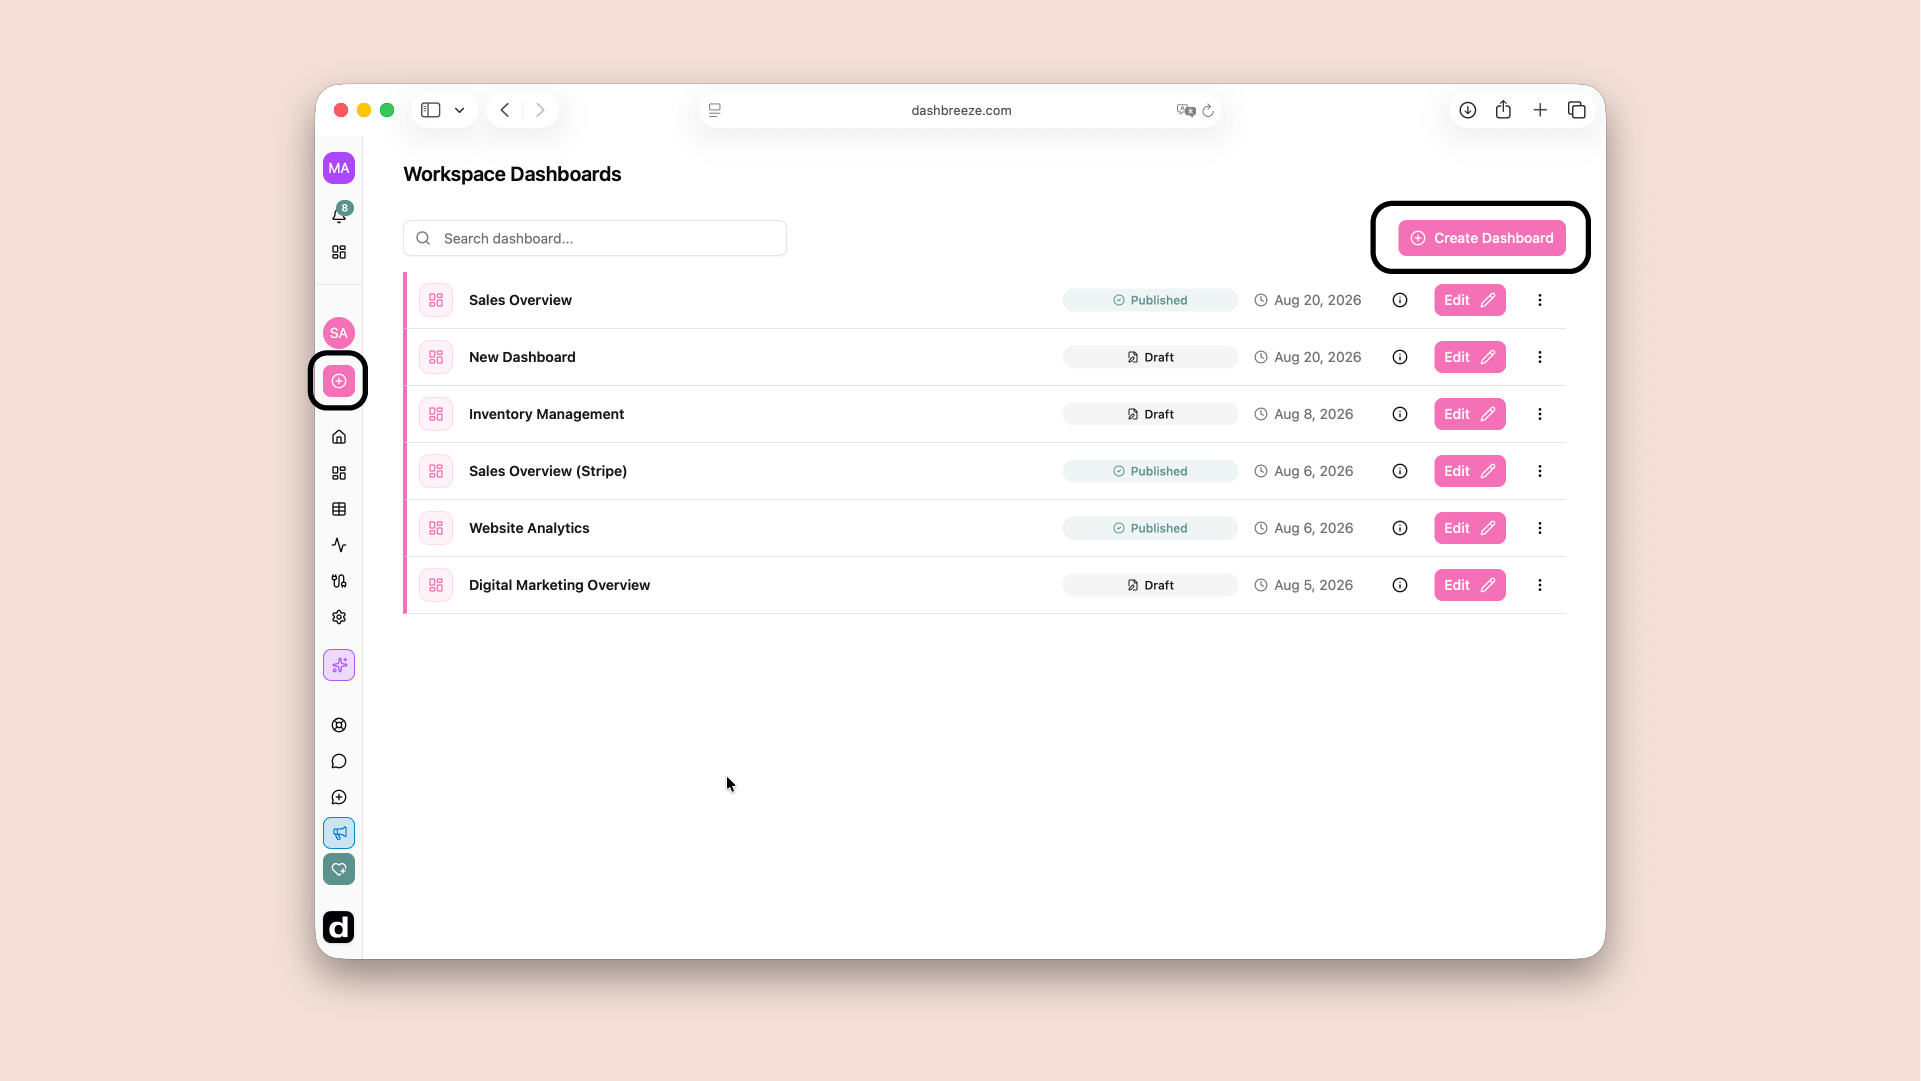
Open your workspace and click Create Dashboard. This opens a blank dashboard. You can now add blocks, connect your data, and choose how the dashboard looks. Any member of the workspace can create a dashboard.
Every new dashboard starts as a Draft. Only workspace members can see it.
You can create one layout for large screens and another for small screens. Changing one layout does not change the other.
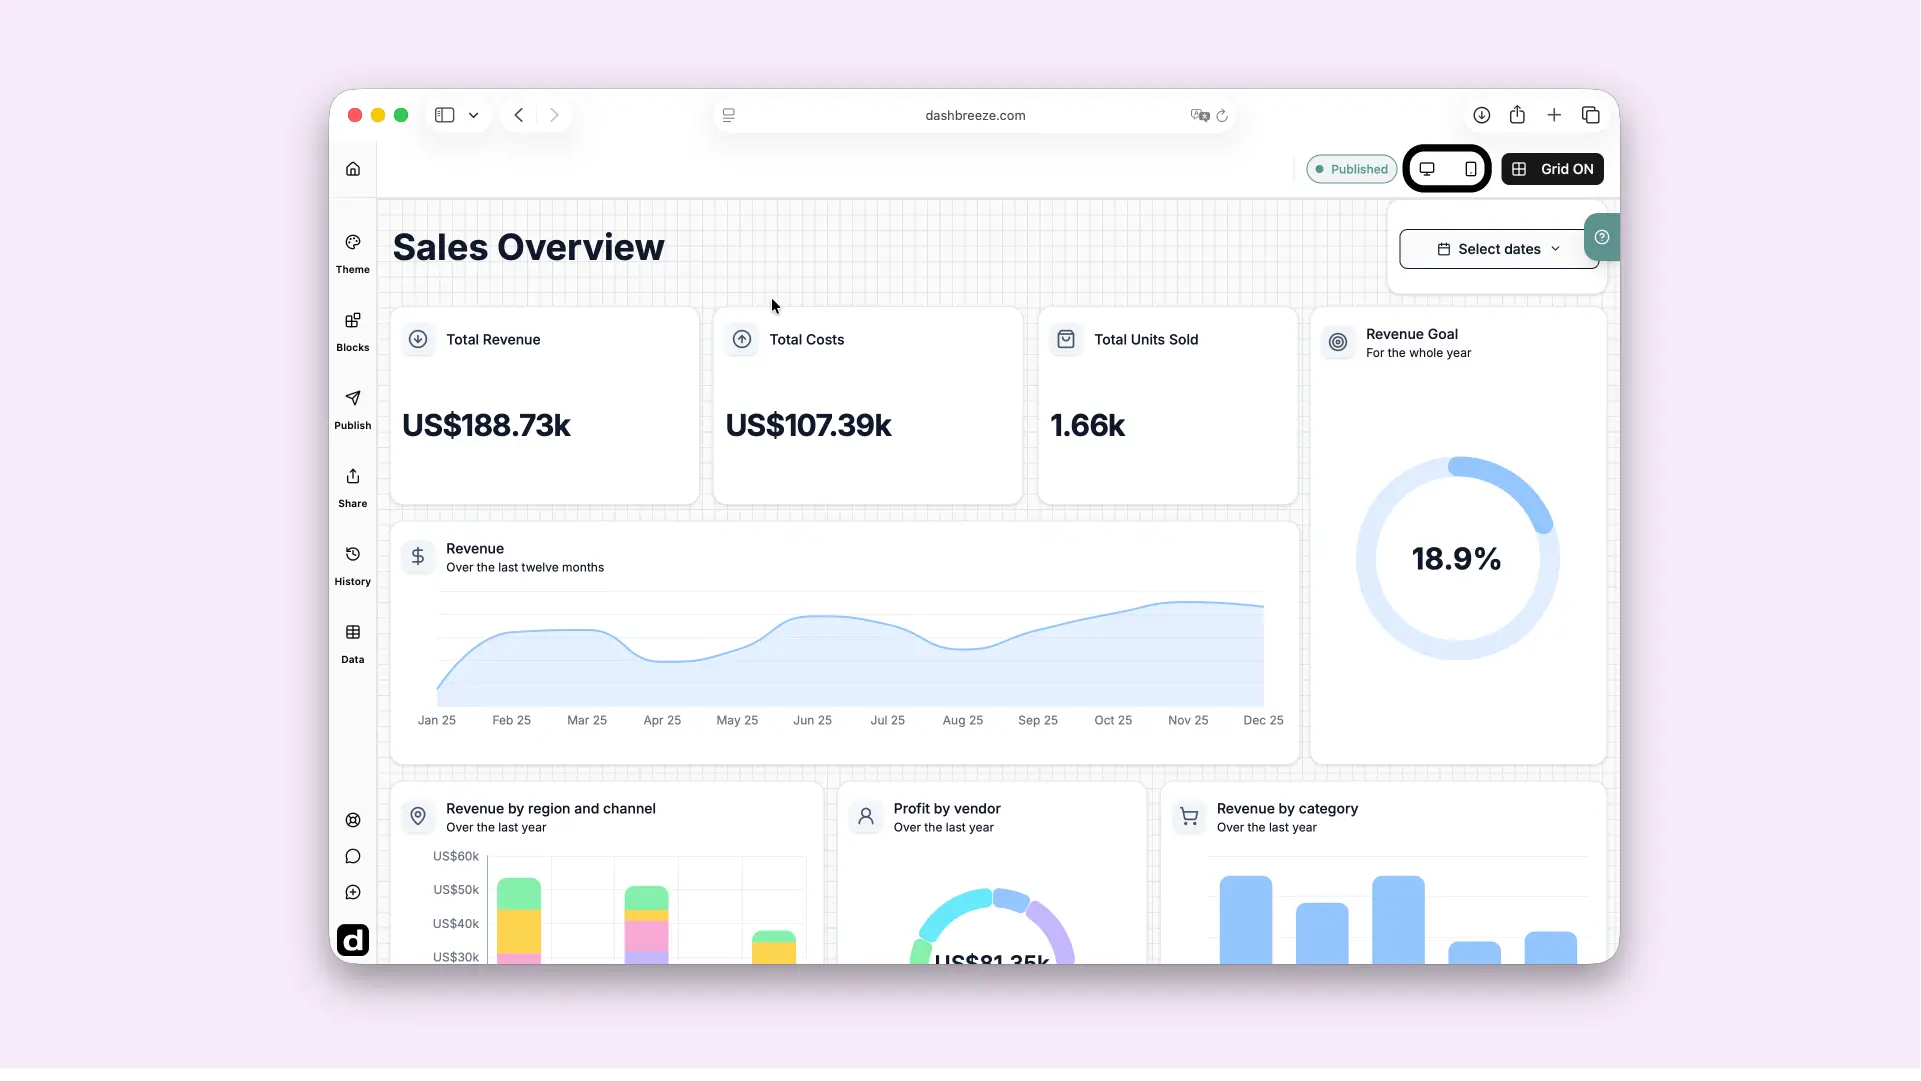
Charts, KPIs, gauges, and tables need data. Click the block, then click Select Table. Choose a table from your workspace. If you do not have a table yet, connect a data source first.
Good to know:Text, image, and embed blocks do not need a table. Use them to add information, images, or other content to your dashboard.
If your table is not in Dashbreeze yet, choose where your data is stored. Then follow the guide for that source. Dashbreeze will turn the imported data into a table you can use in a block.
Choose your starting point
Where does your data live?
Spreadsheets & files
Connect a spreadsheet or upload a file from your device.
When the table is ready, return to your dashboard. Click the block, click Select Table, and choose the new table.
The status tells you who can see the dashboard and whether viewers can see your latest changes.
| Status | What it means |
|---|---|
| Draft | You have not published the dashboard yet. Only workspace members can see it. |
| Published | The dashboard is live. People with access can see the latest published version. |
| Unpublished Changes | Workspace members see your latest changes in the editor. Viewers still see the last published version until you publish again. |
To make a dashboard live, open Publish in the left sidebar. Then click Publish Dashboard. Publish again whenever you want viewers to see your latest changes. Each publish also saves a version in Version History.
Good to know:Your edits do not appear on the live dashboard until you publish again.
On the home page, each dashboard shows its name, status, and last update date. Click the Dashboard information icon to open the Dashboard Info panel. This panel shows:
Click Edit to change the dashboard. Open the actions menu to:
The copy and the original are separate dashboards. Changing one does not change the other. Publish the copy when it is ready to share.
Before you delete a dashboard:Deleting a dashboard cannot be undone. Make a copy first if you may need it later.