

Using Metrics in Dashboards
Add a saved metric to a KPI or Gauge block and reuse the same calculation across dashboards.

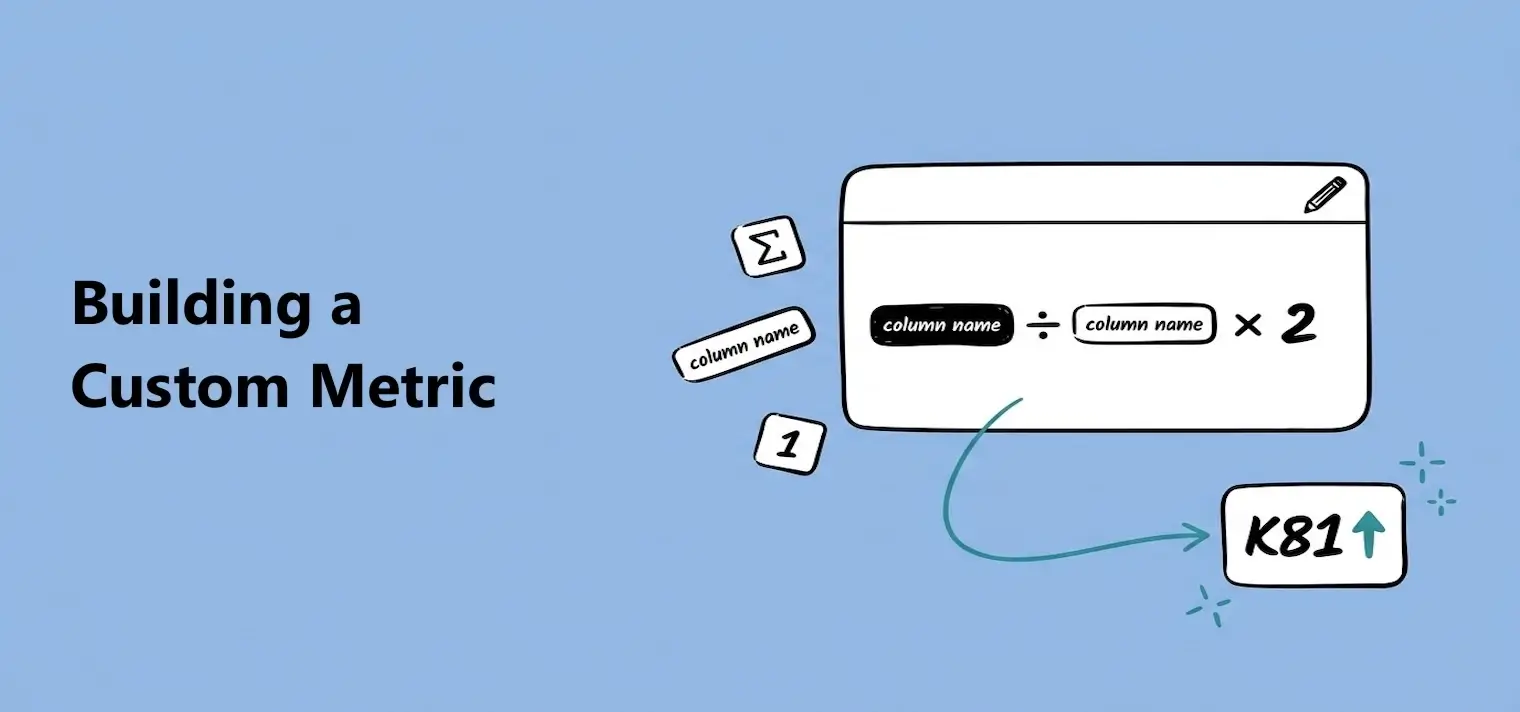
A custom metric turns your table data into a calculation that updates with your dashboard — revenue per order, profit margin, conversion rate, growth over time, anything a formula can express.
Build it from table columns, saved metrics, numbers, and operators. Dashbreeze shows the result as you go, and once it's saved, any KPI or Gauge in your workspace can reuse it.
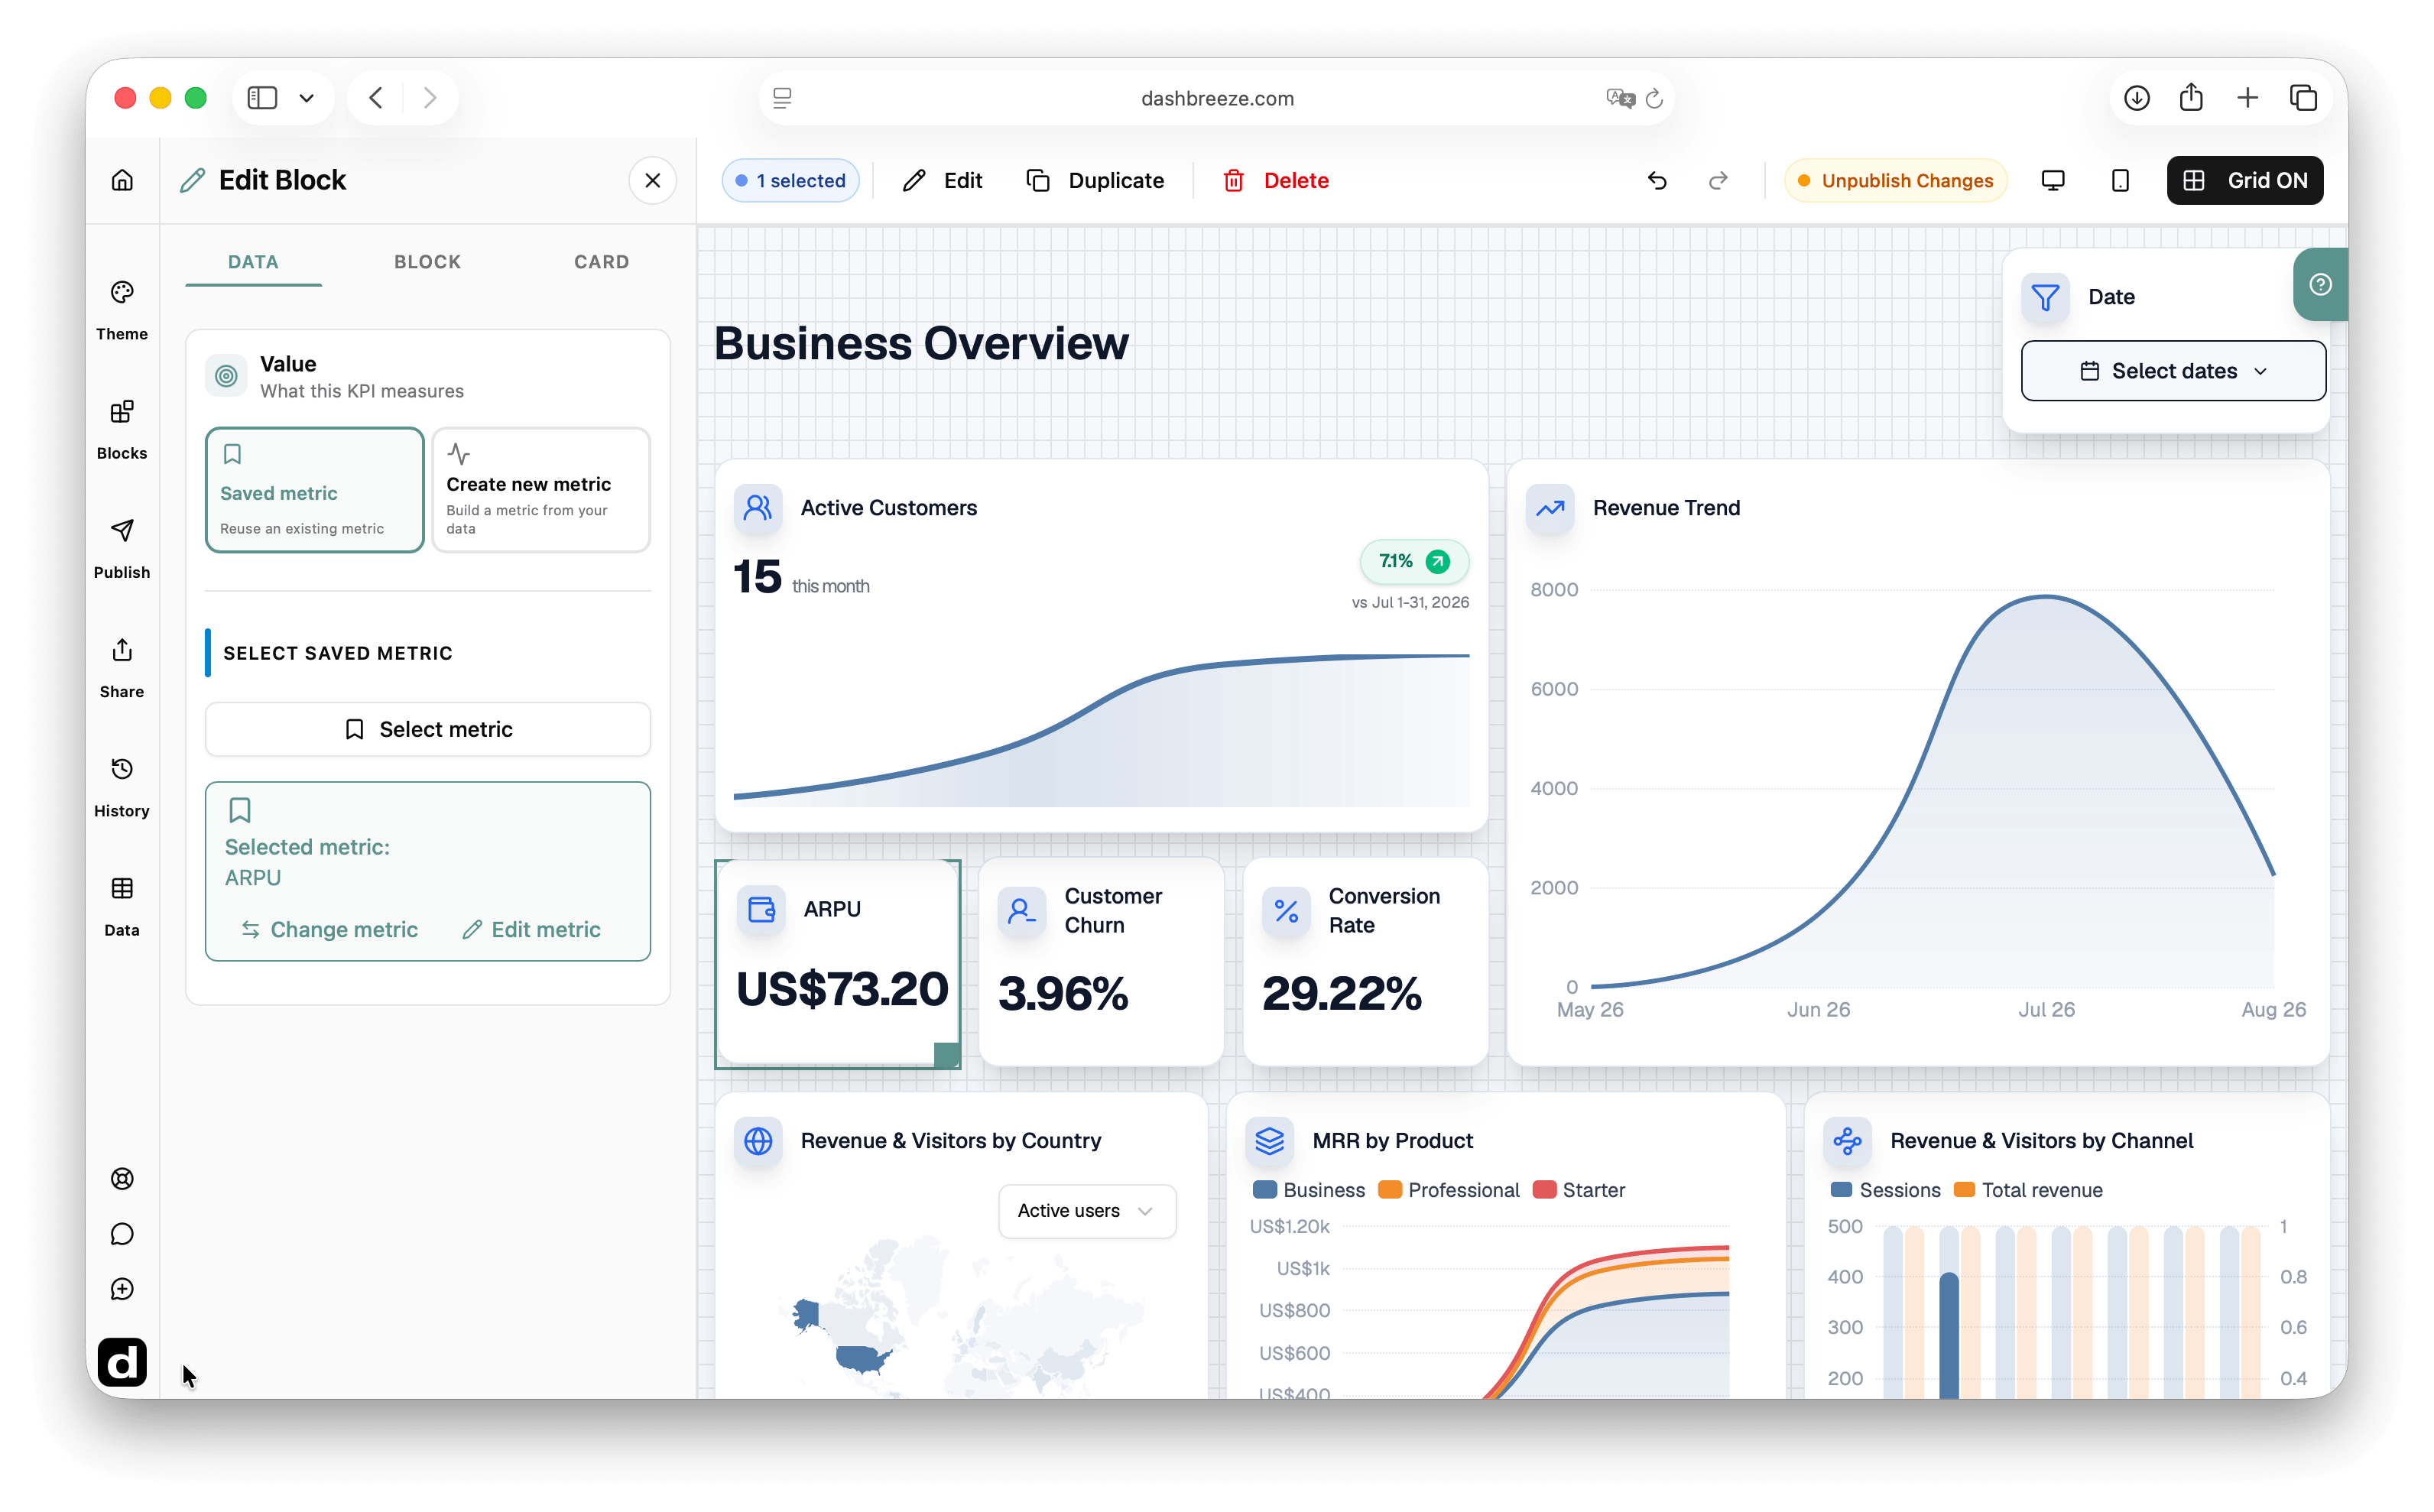
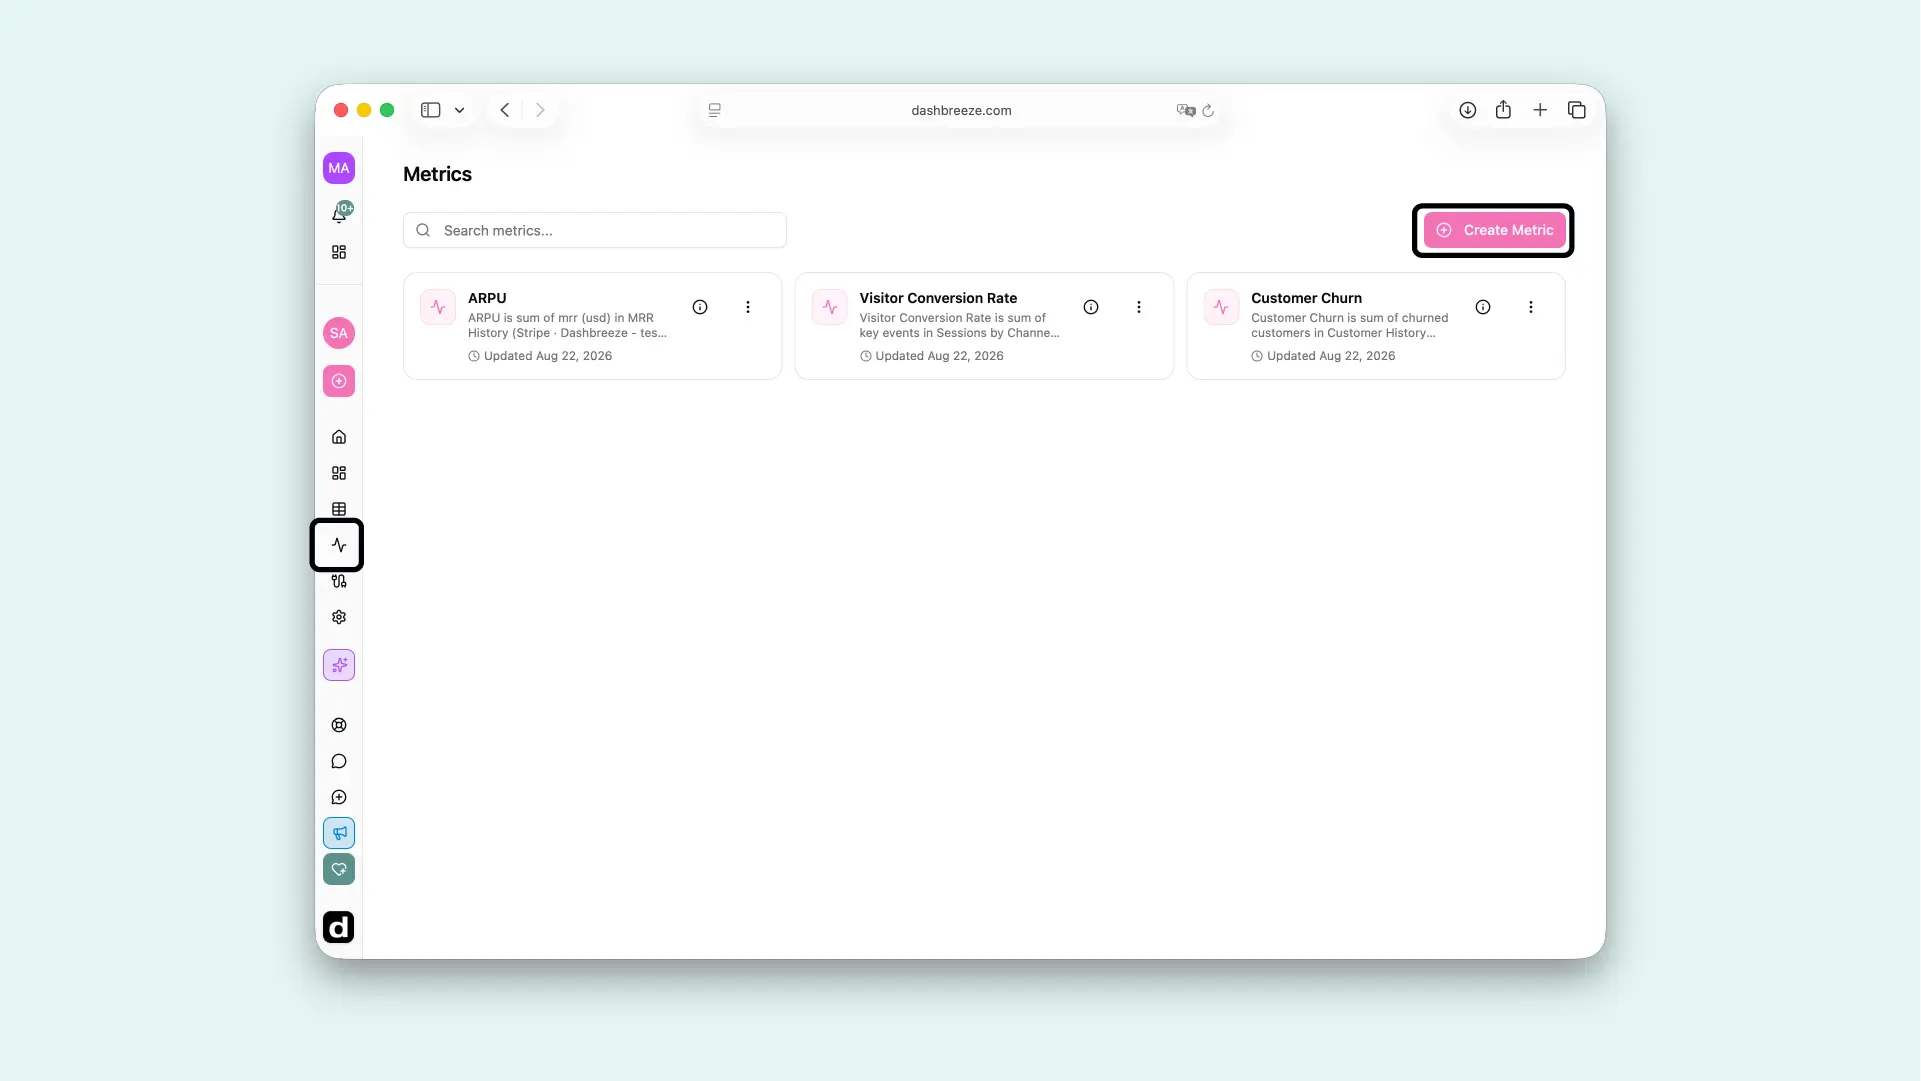
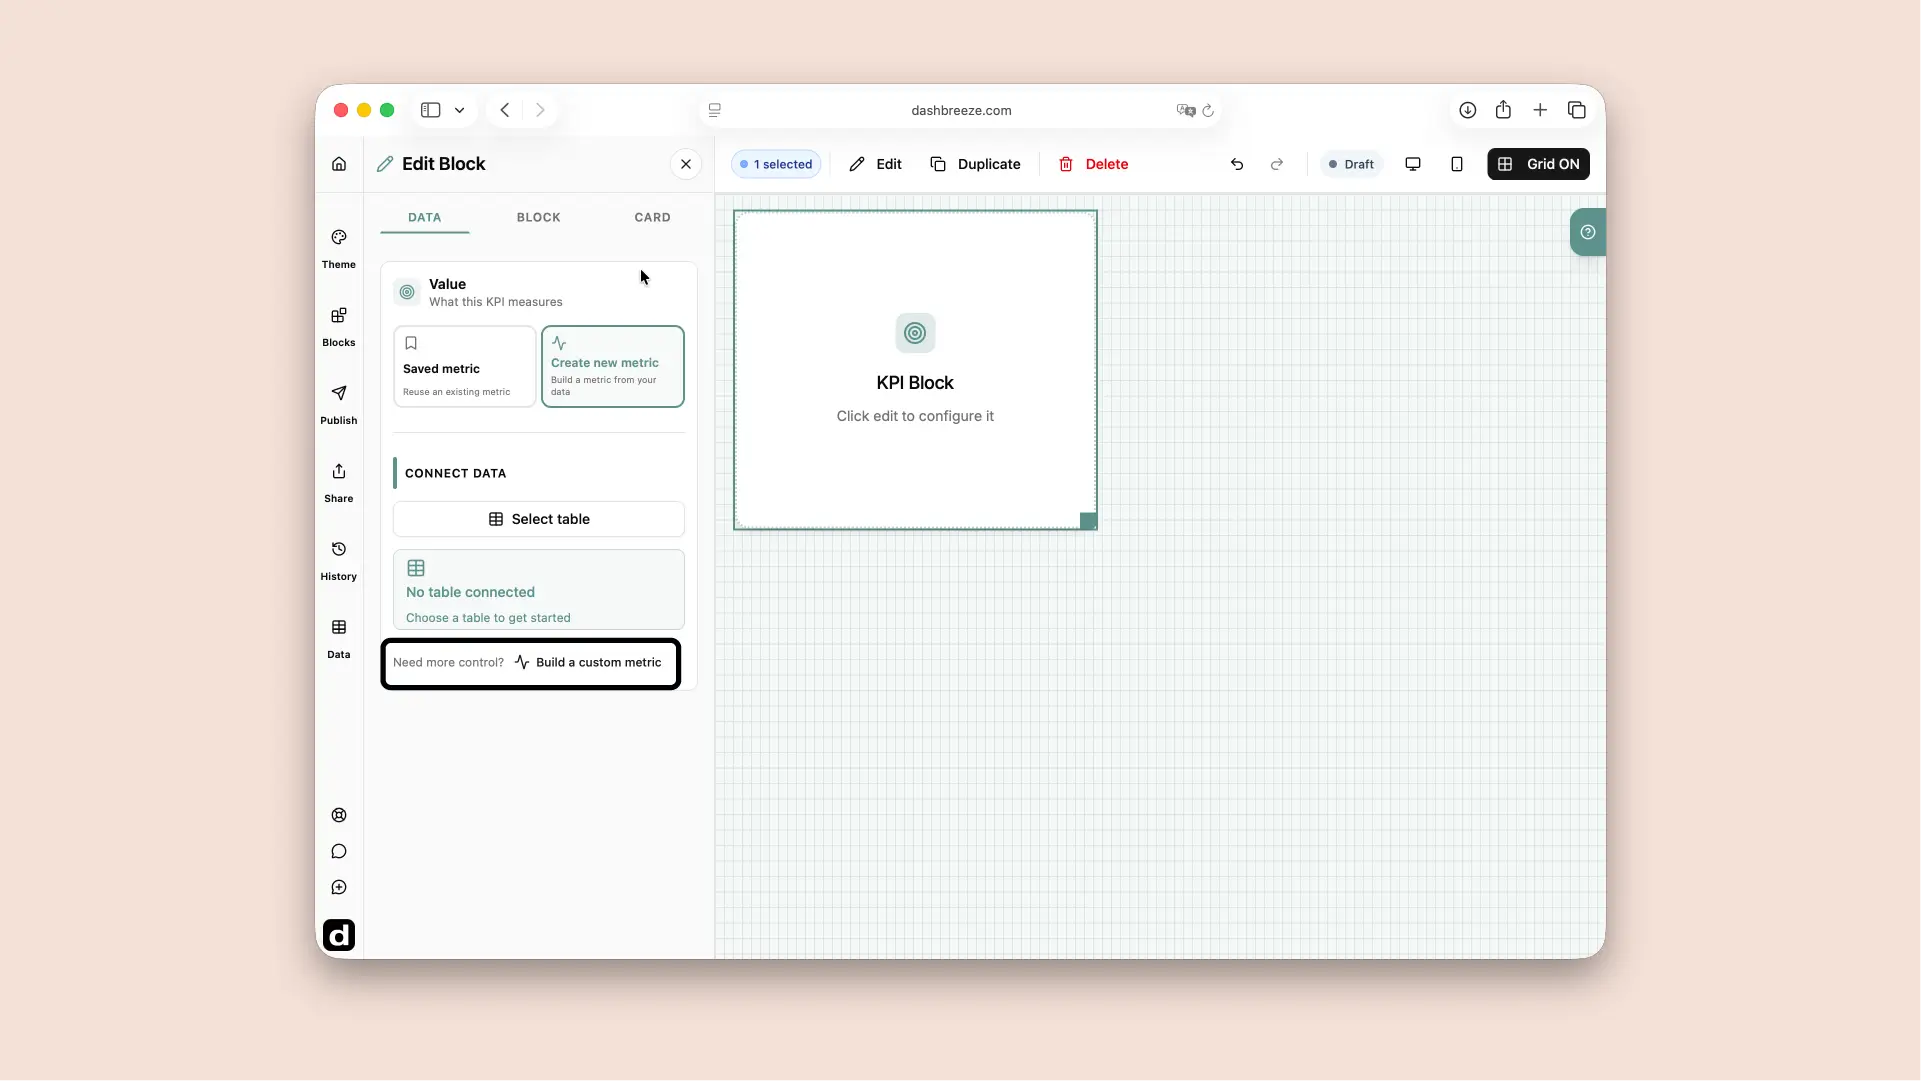
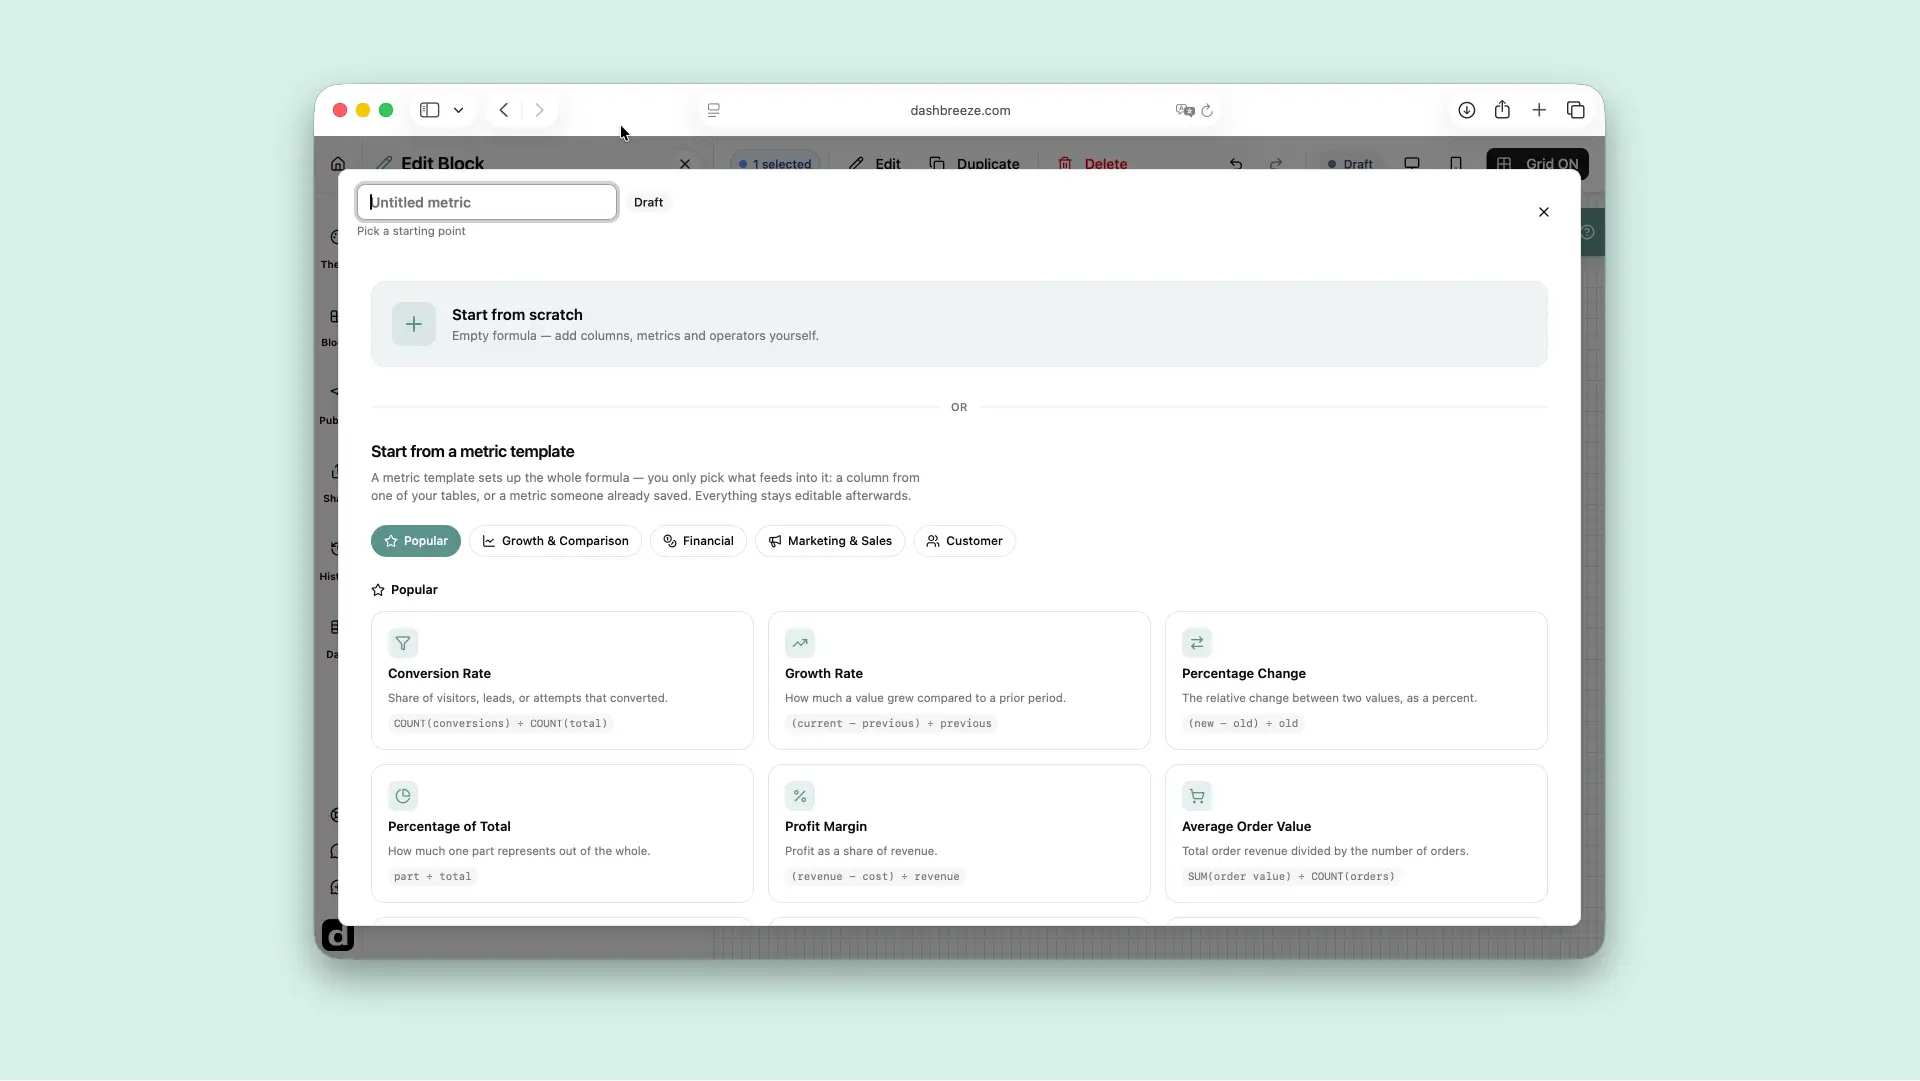
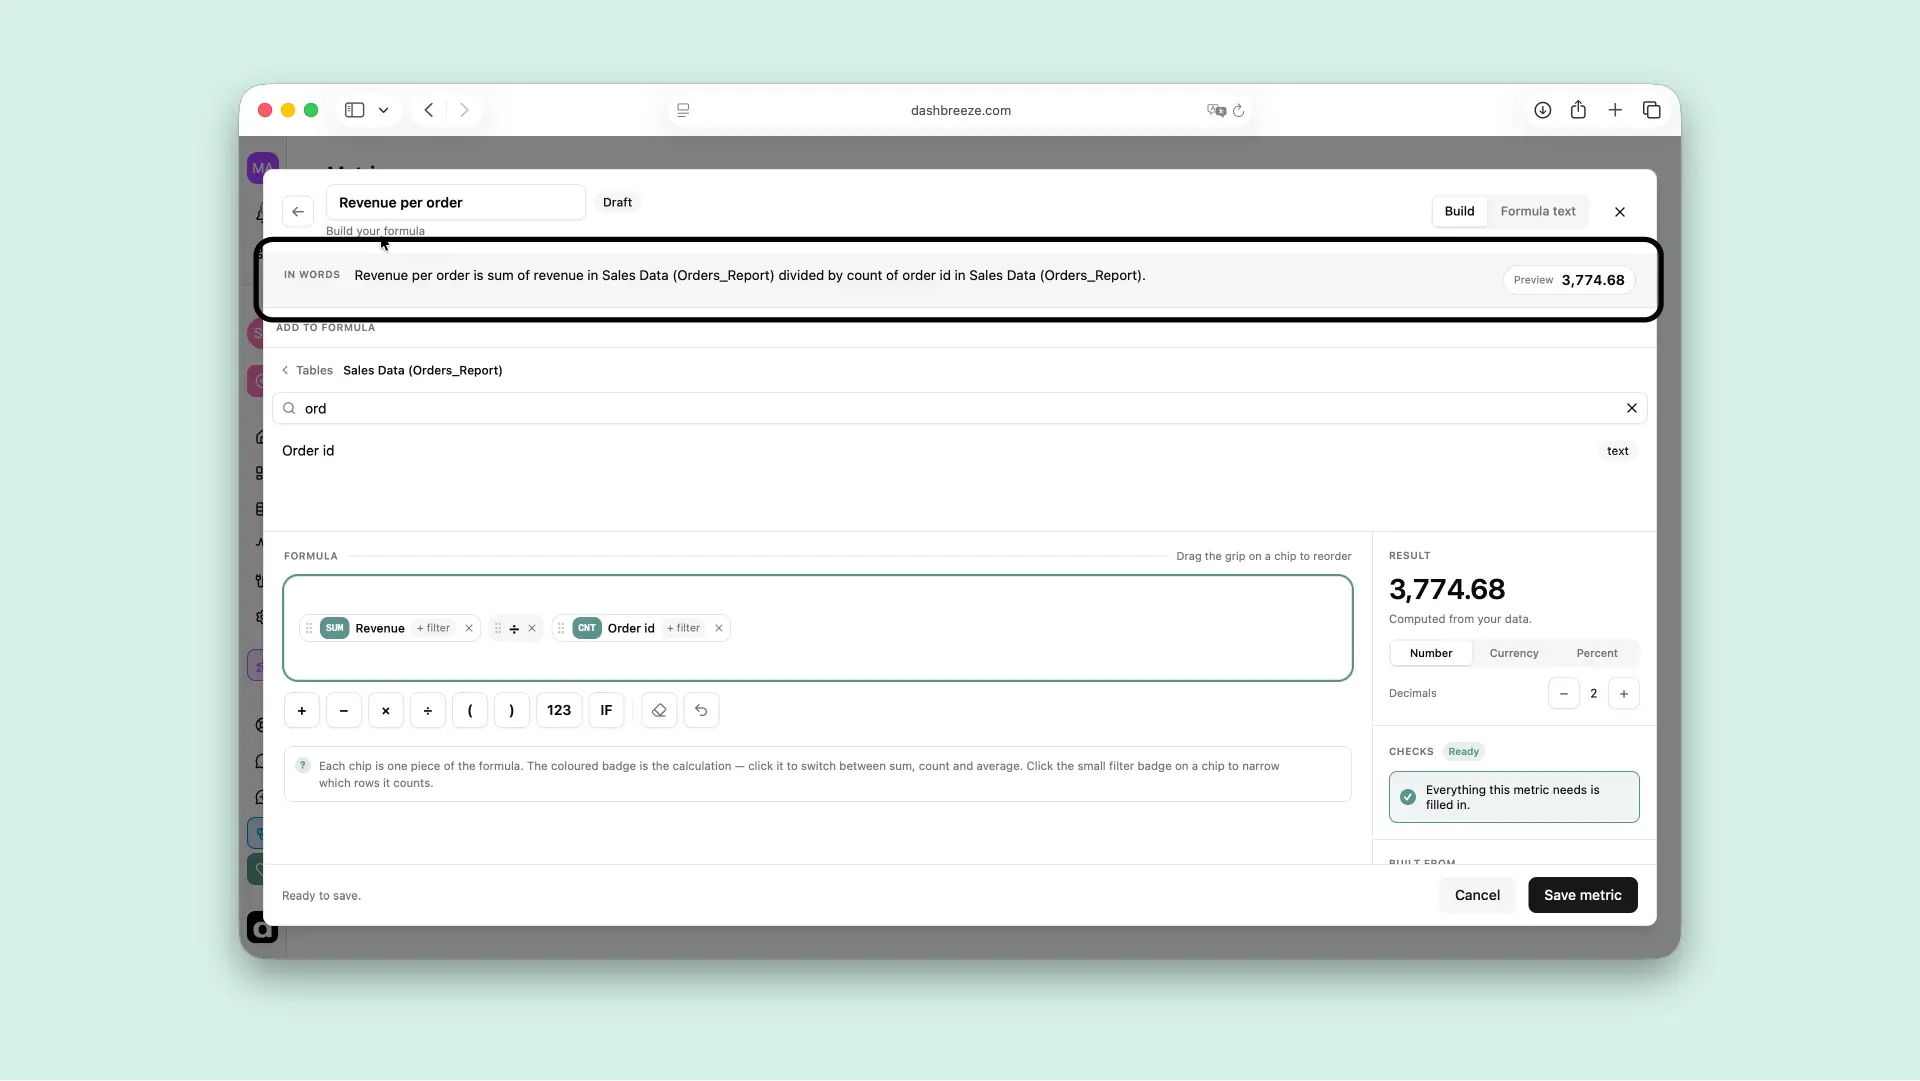
Start from scratch opens an empty formula: add a table column or saved metric, choose an operator, add the next value, and keep going until the formula is complete. Say your Orders table has a Revenue column and an Order ID column — to find the average revenue per order, build this formula:
Select the table column or saved metric you want to use first — add Revenue and leave its calculation mode as SUM, since you want the total revenue across every order.
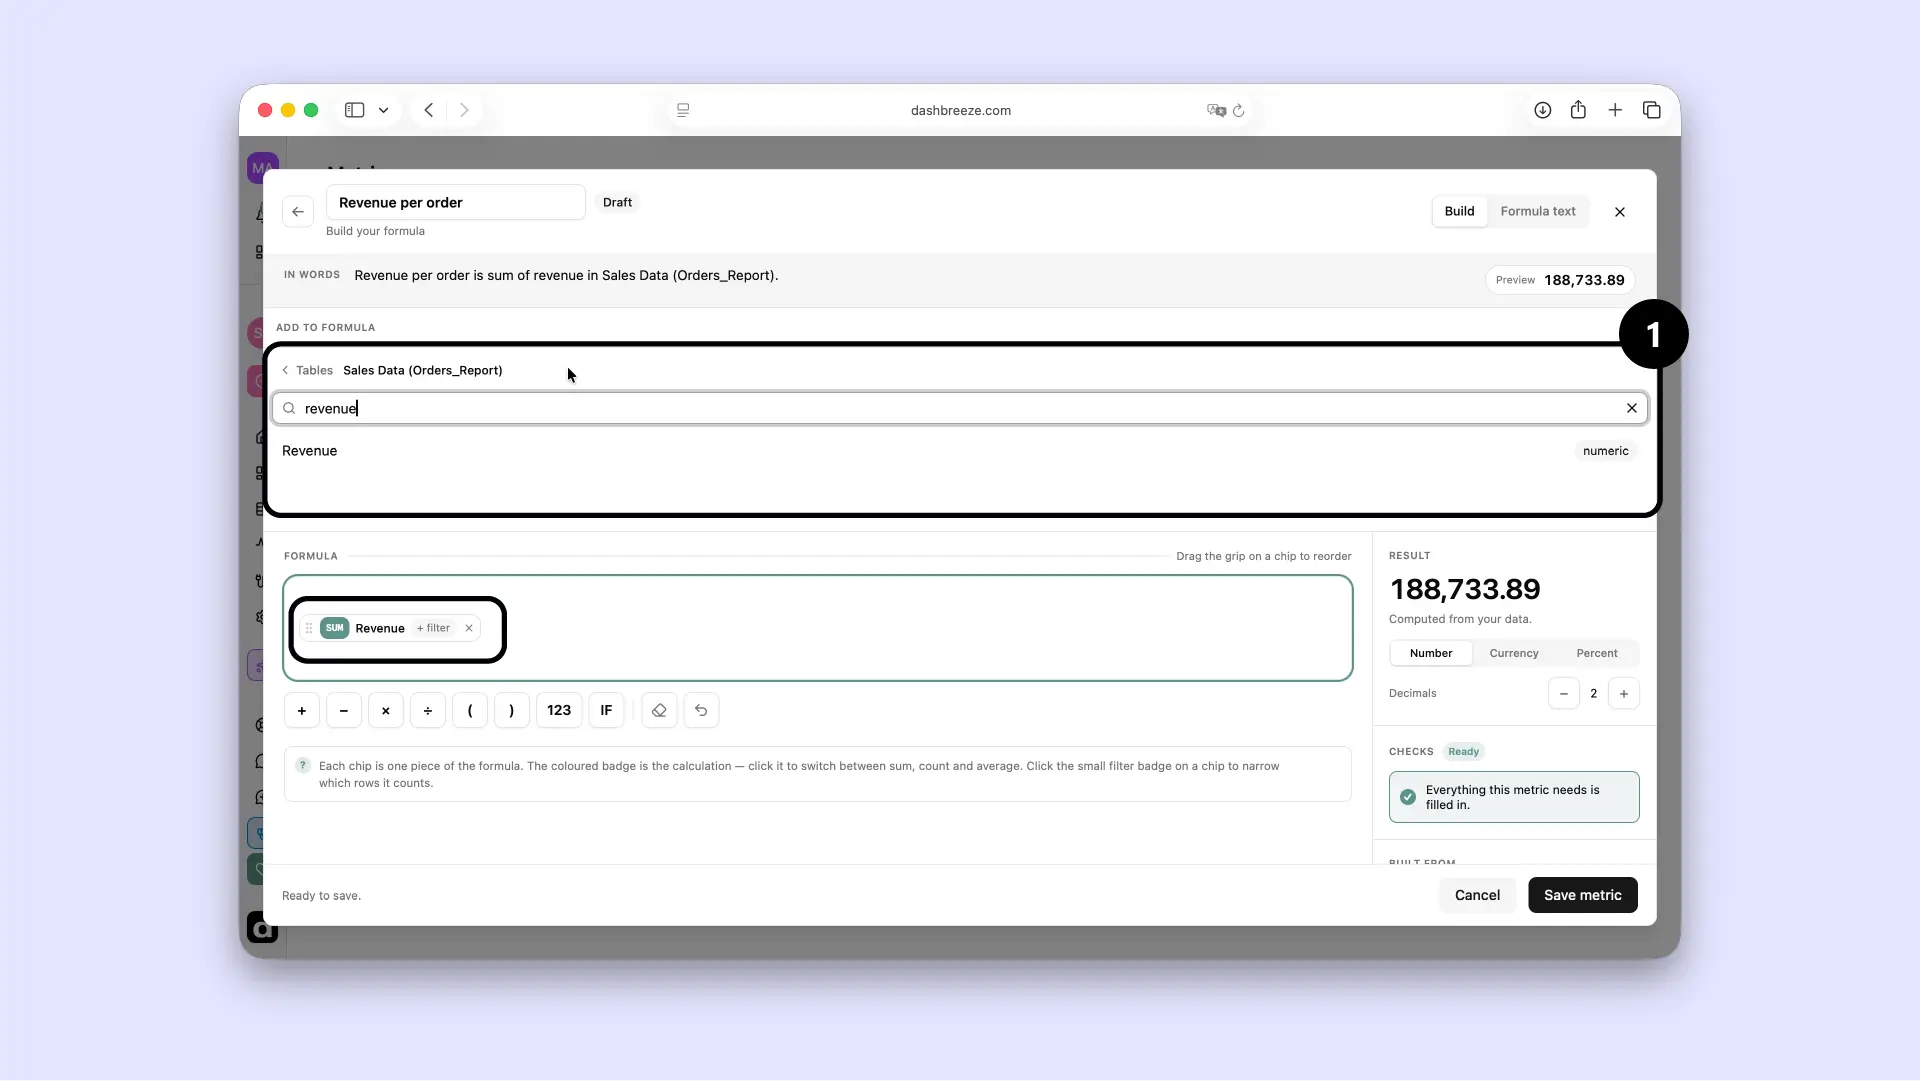
Each column becomes one value first:A calculation mode tells Dashbreeze how to turn a column into one number — SUM, AVG, CNT, DST, MIN, or MAX, depending on the column type. Select the badge on a column to change it.
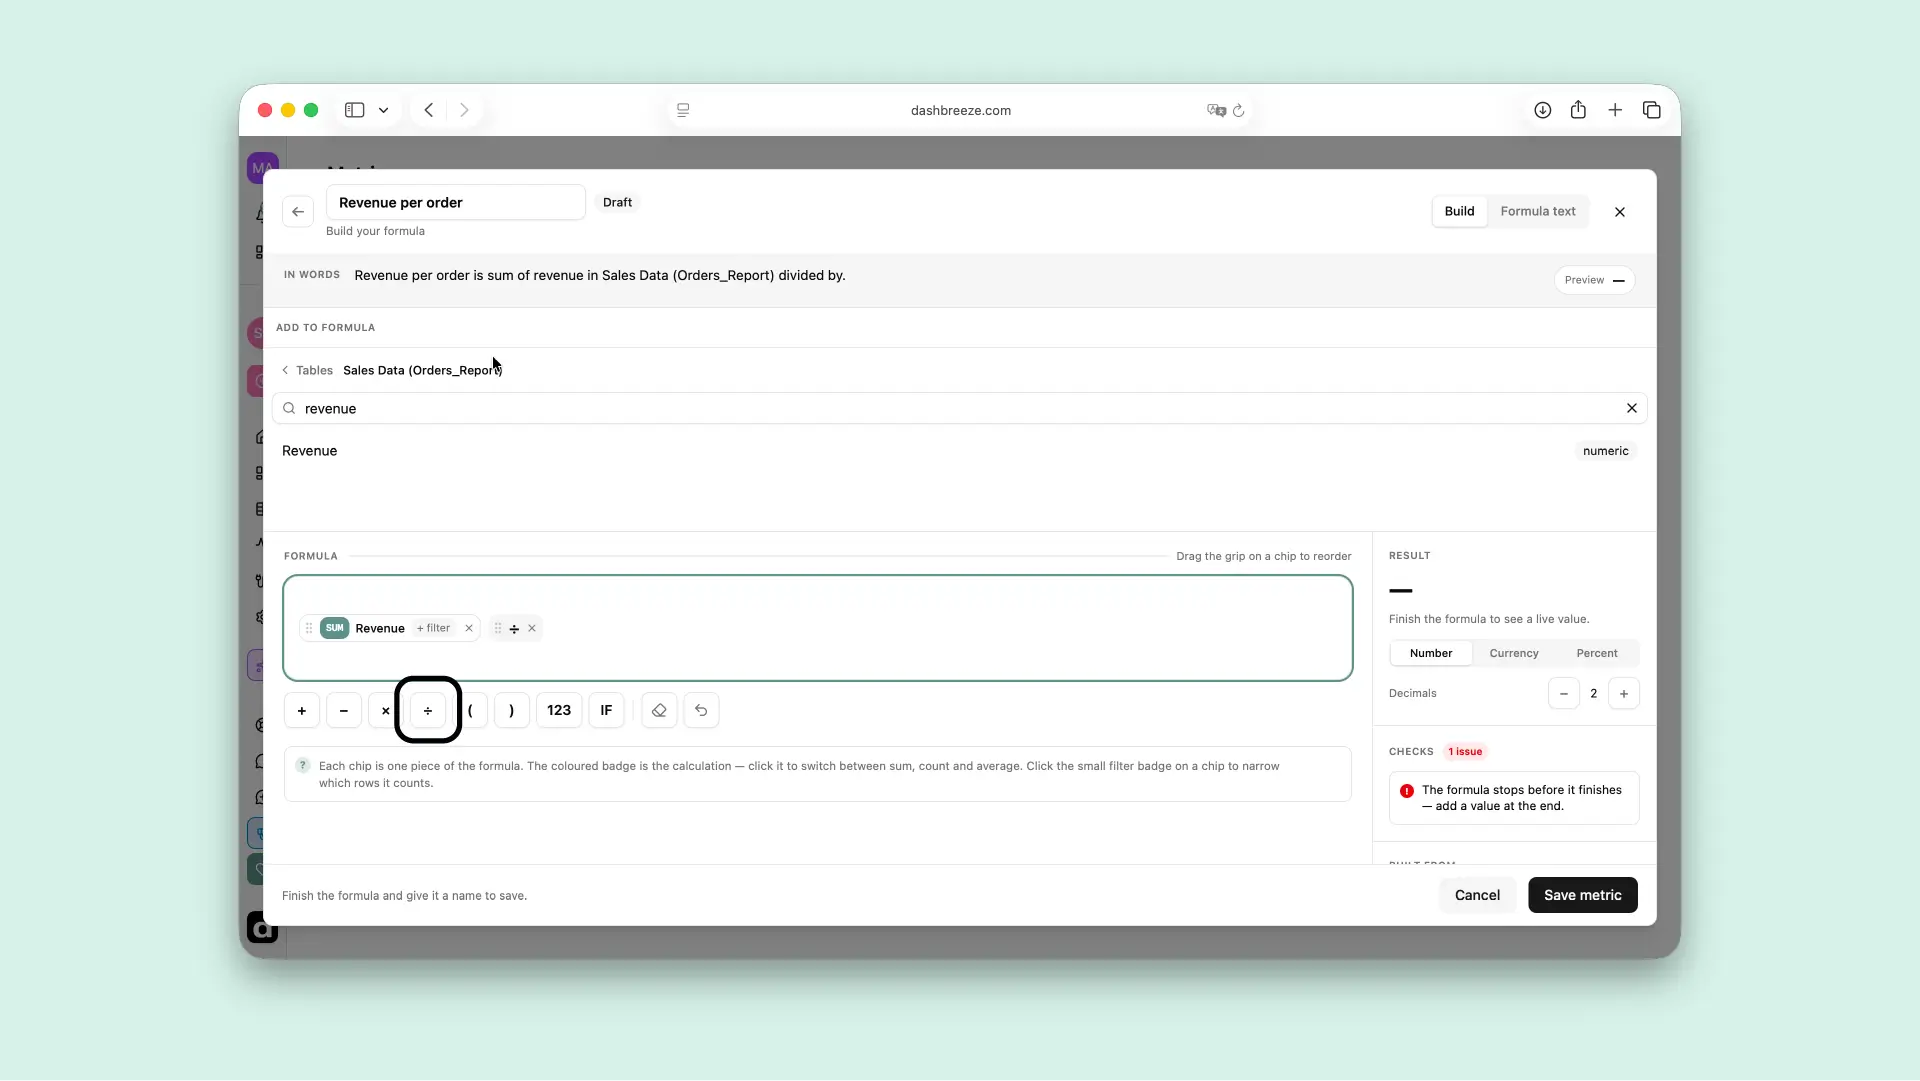
Choose an operator to combine it with the next value — select the divide operator ÷.
Add the next piece of the formula — add Order ID and switch its calculation mode to CNT, so Dashbreeze counts how many orders there are.
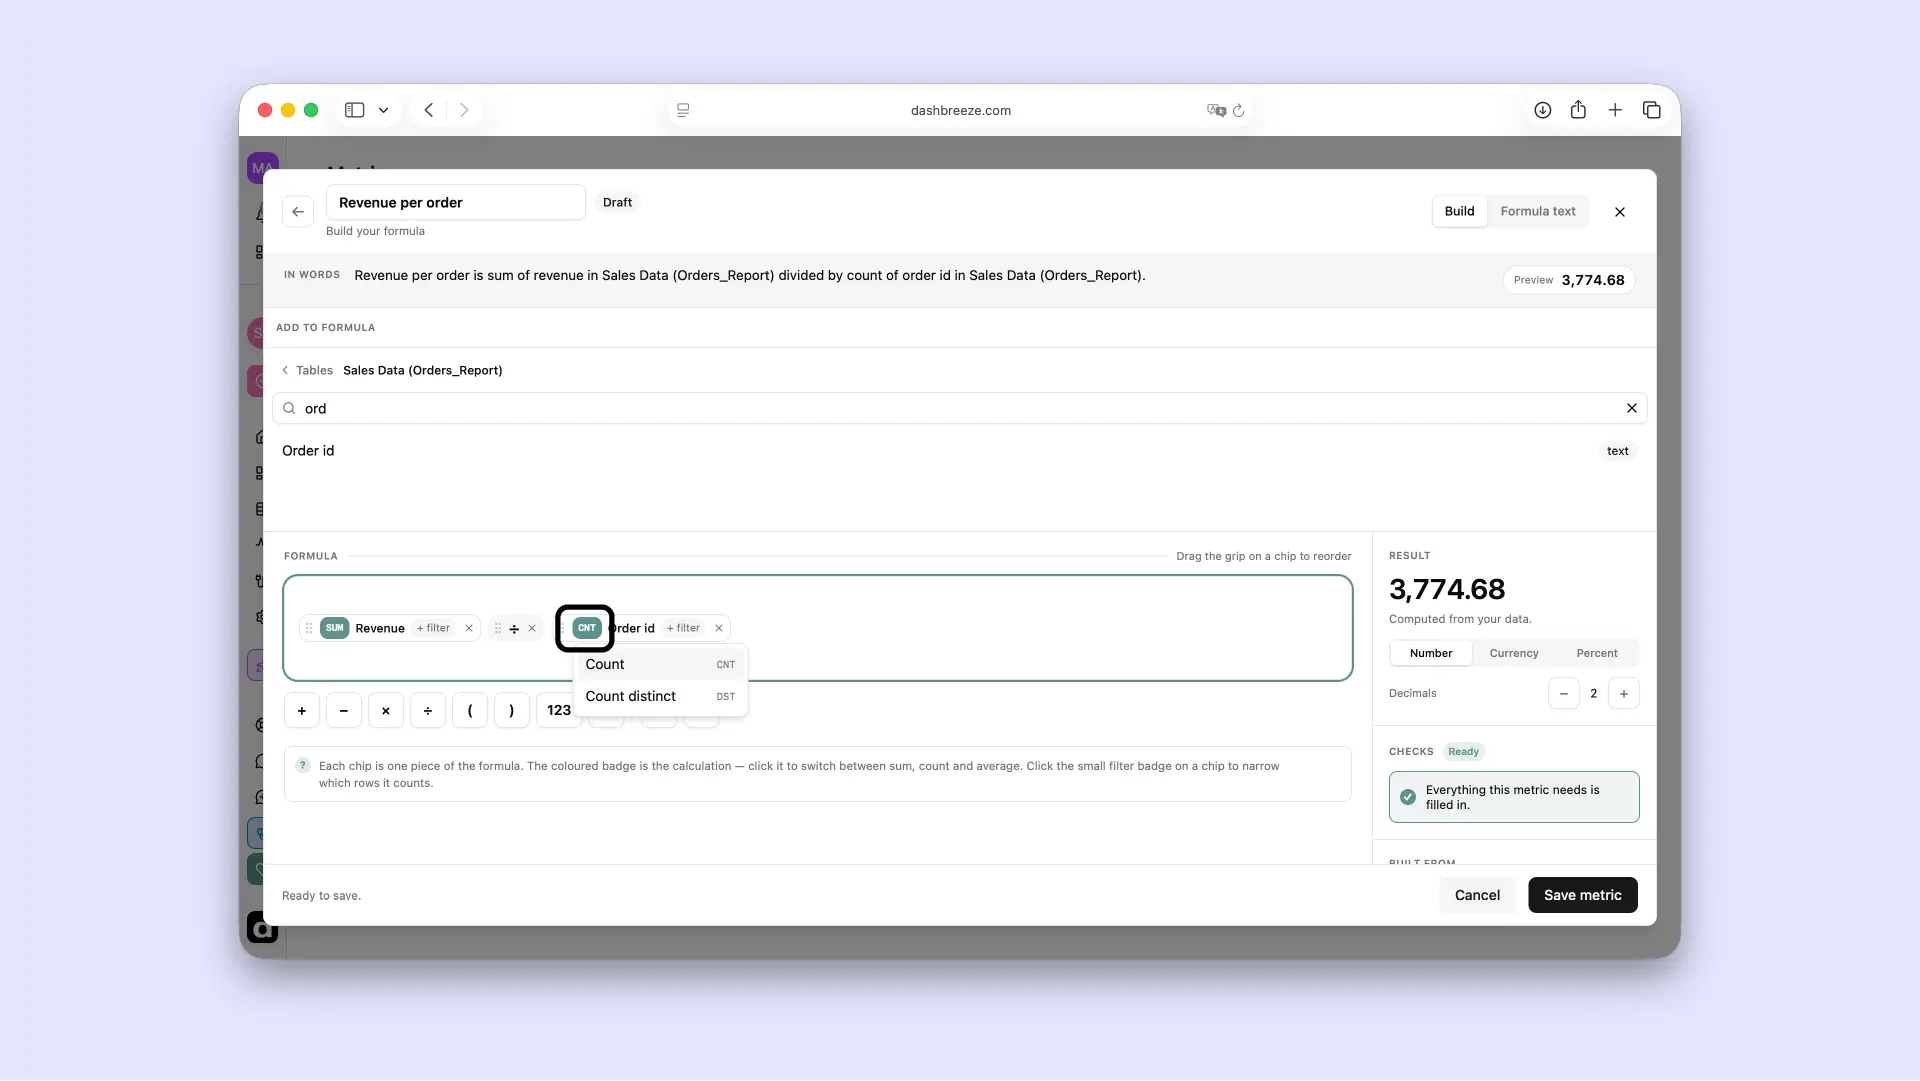
Check the live result and the In words summary — it should read back as "Sum of Revenue divided by Count of Order ID" and match the question you're asking.
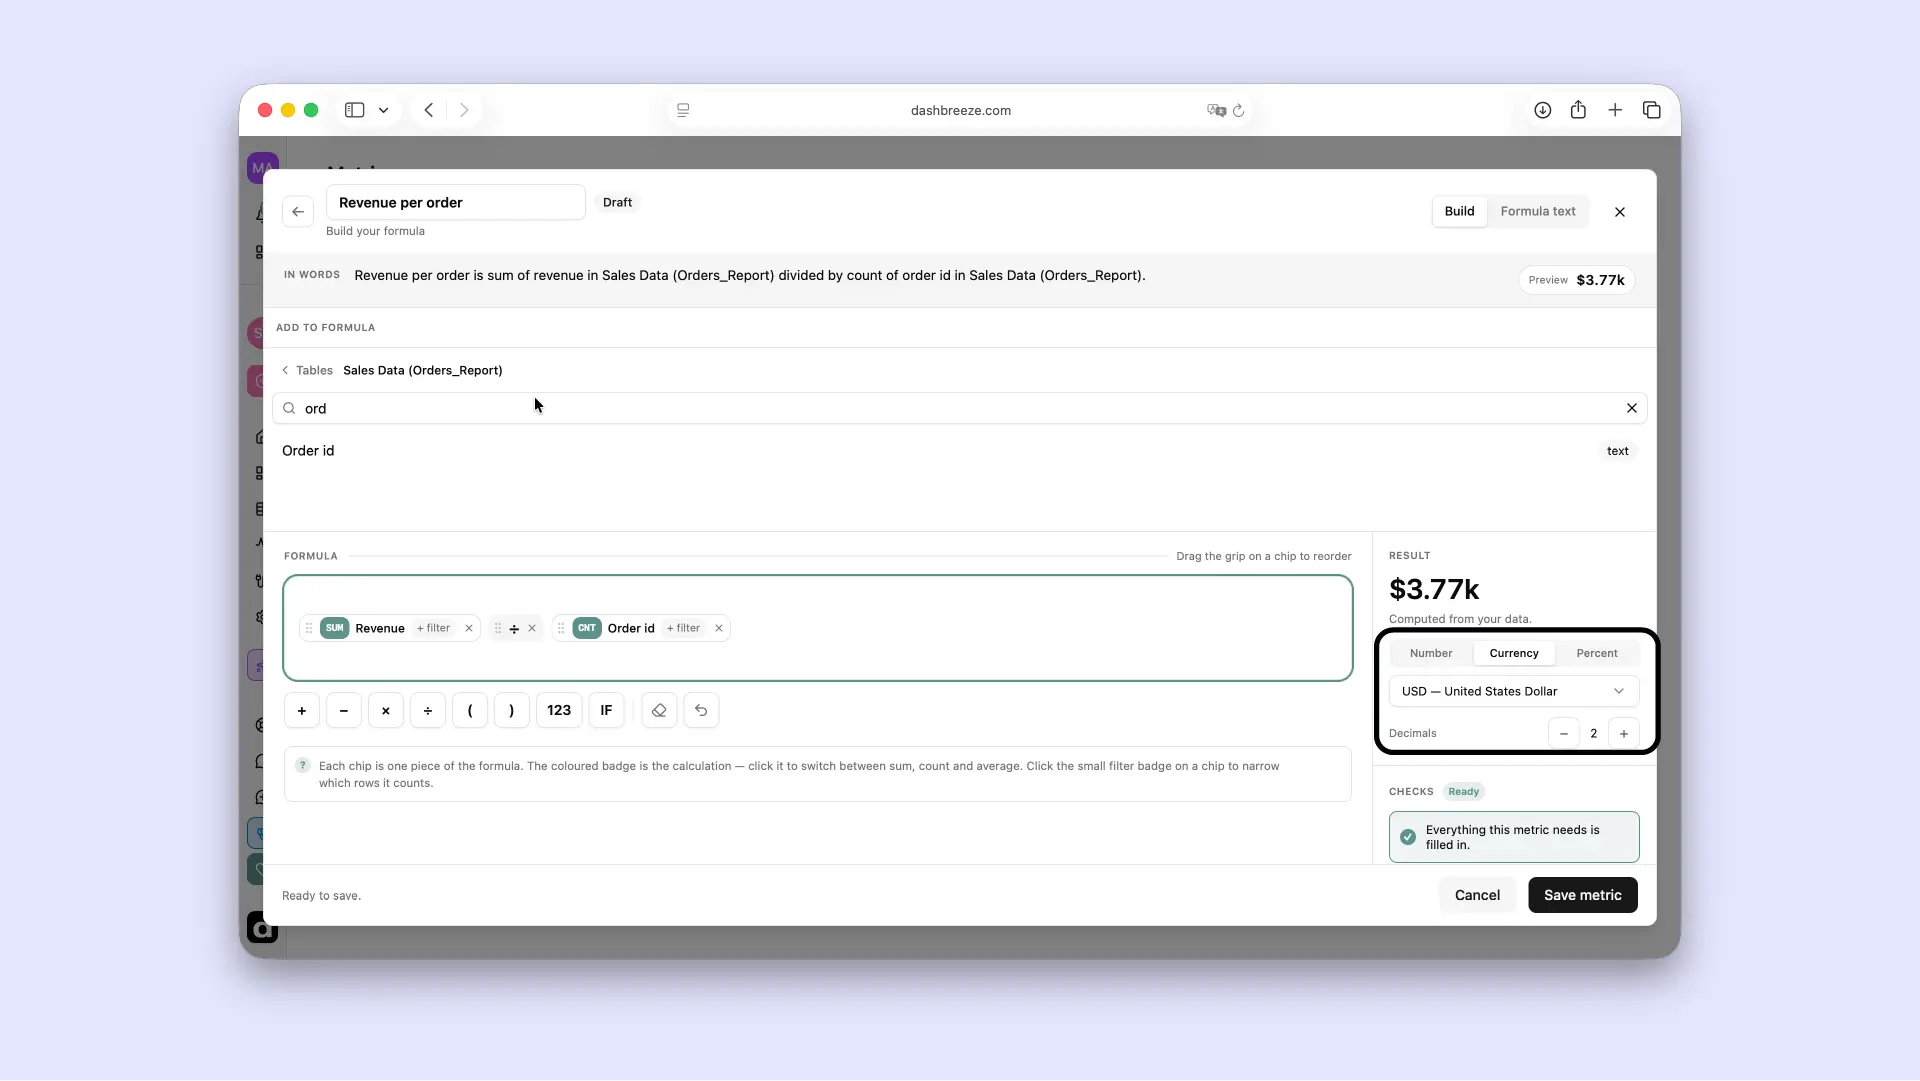
Choose a number format and decimals so the result displays the way you want, confirm Checks shows Ready, then select Save metric to store it in your workspace.
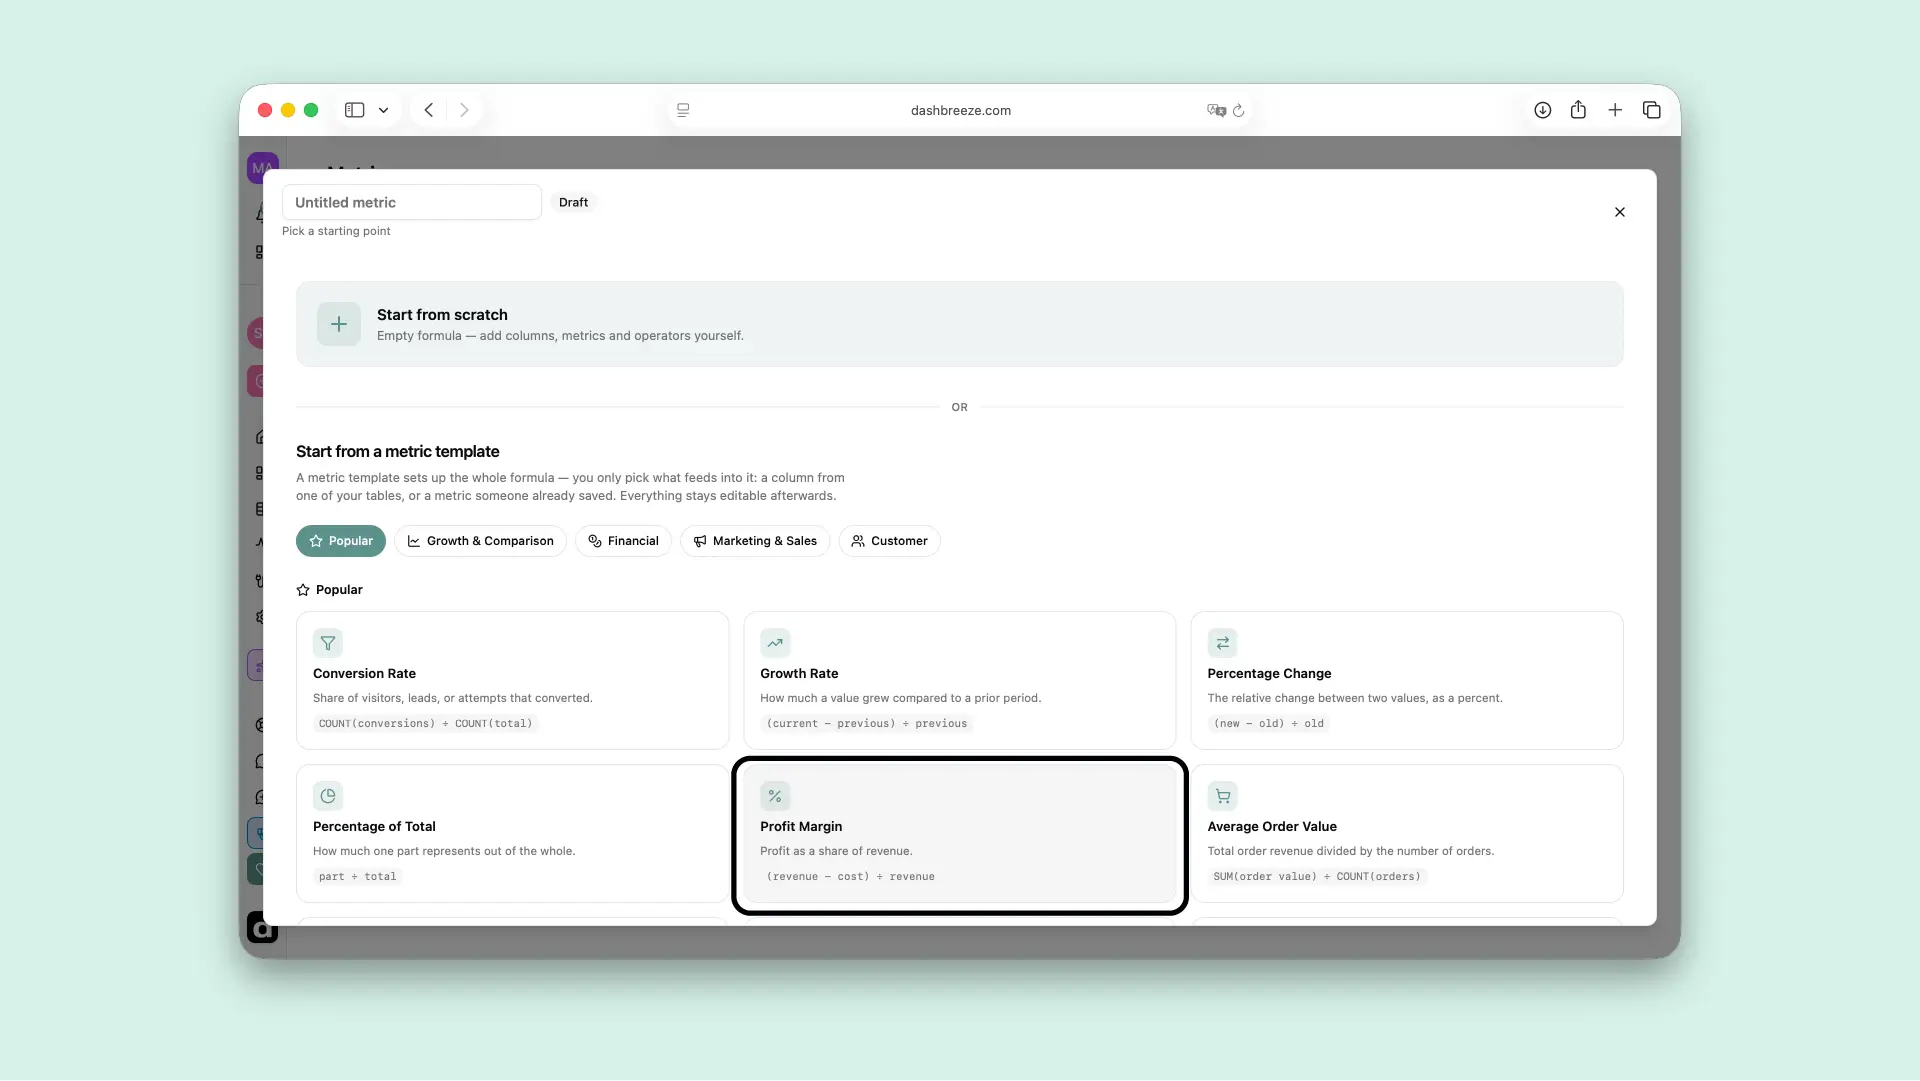
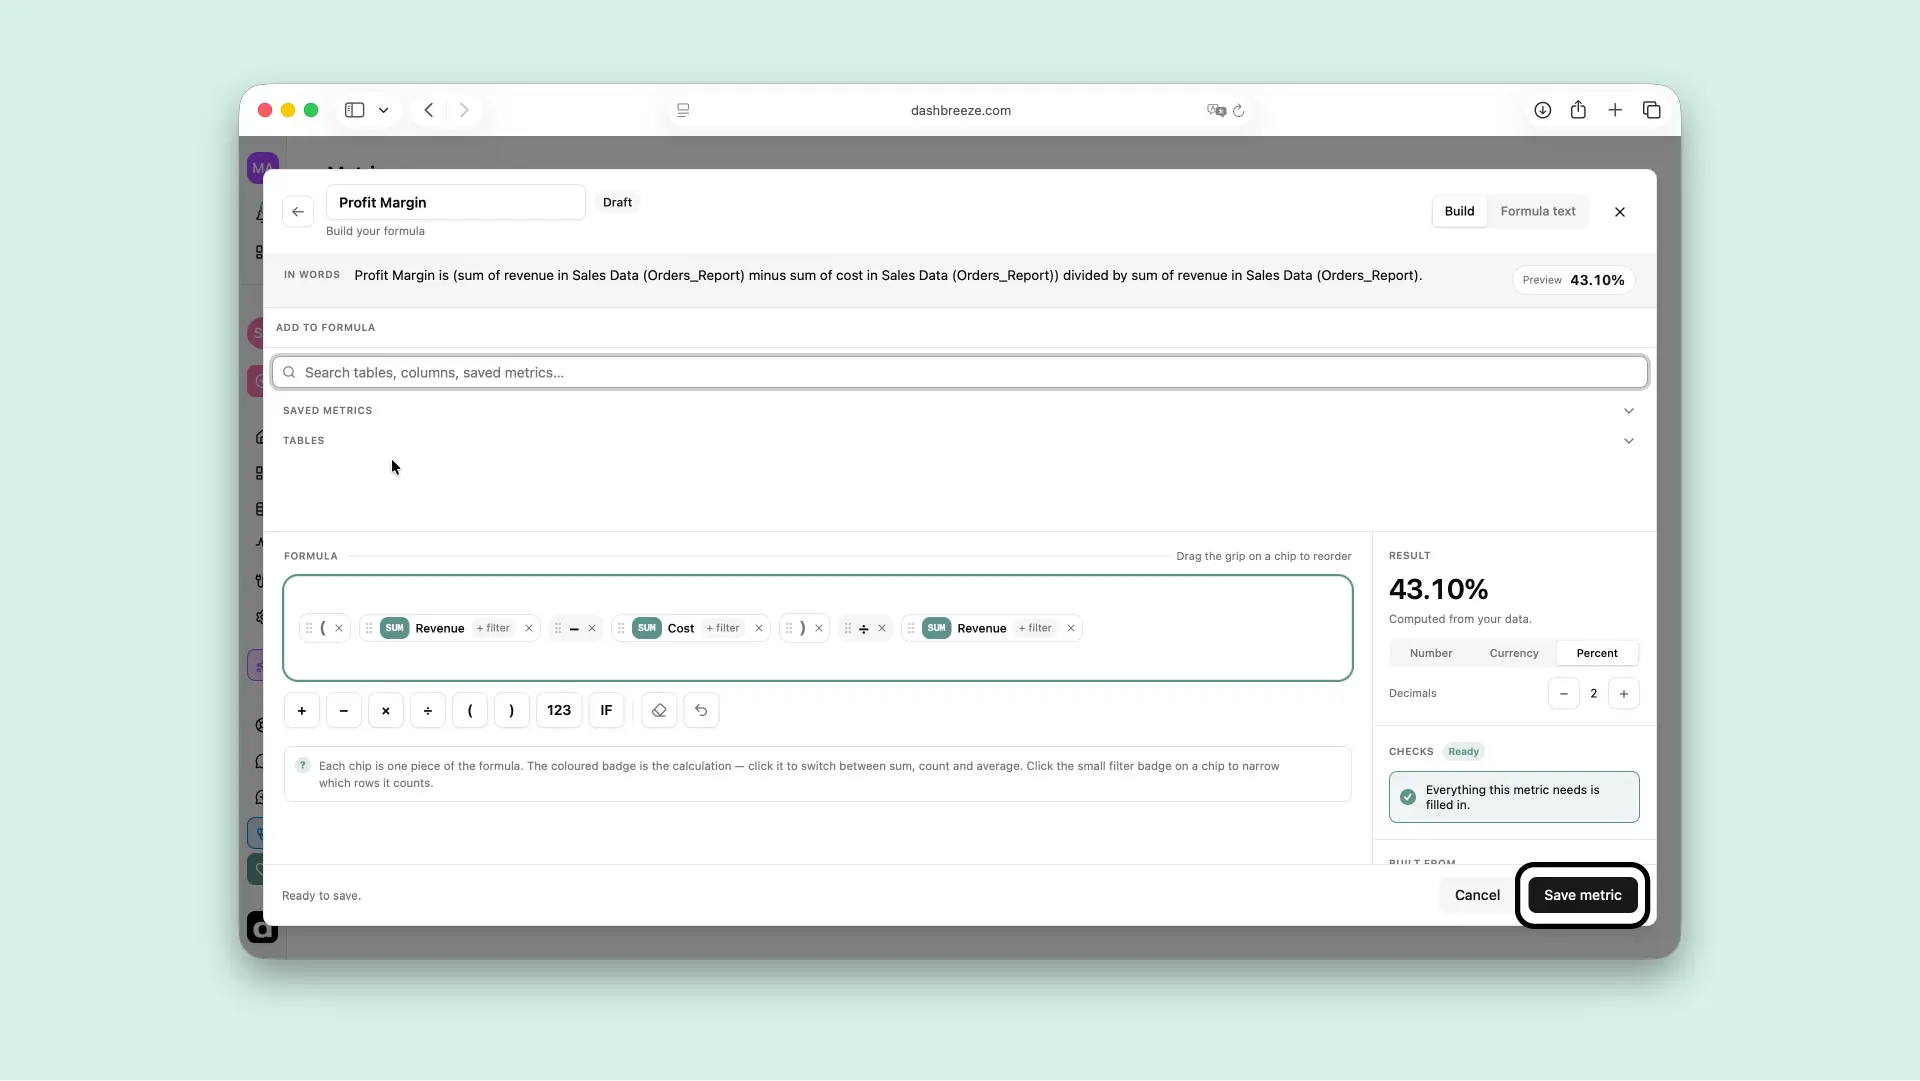
A template sets up the whole formula — you only pick what feeds into it. Templates cover common calculations, including Conversion Rate, Growth Rate, Profit Margin, ROI, Customer Acquisition Cost, Churn Rate, and Lifetime Value. For example, the Profit Margin template builds this formula:
Choose the Profit Margin template and review what it measures — profit as a share of revenue.
Match Revenue and Cost to the matching columns in your Orders table or a saved metric. When you finish, click Use these.
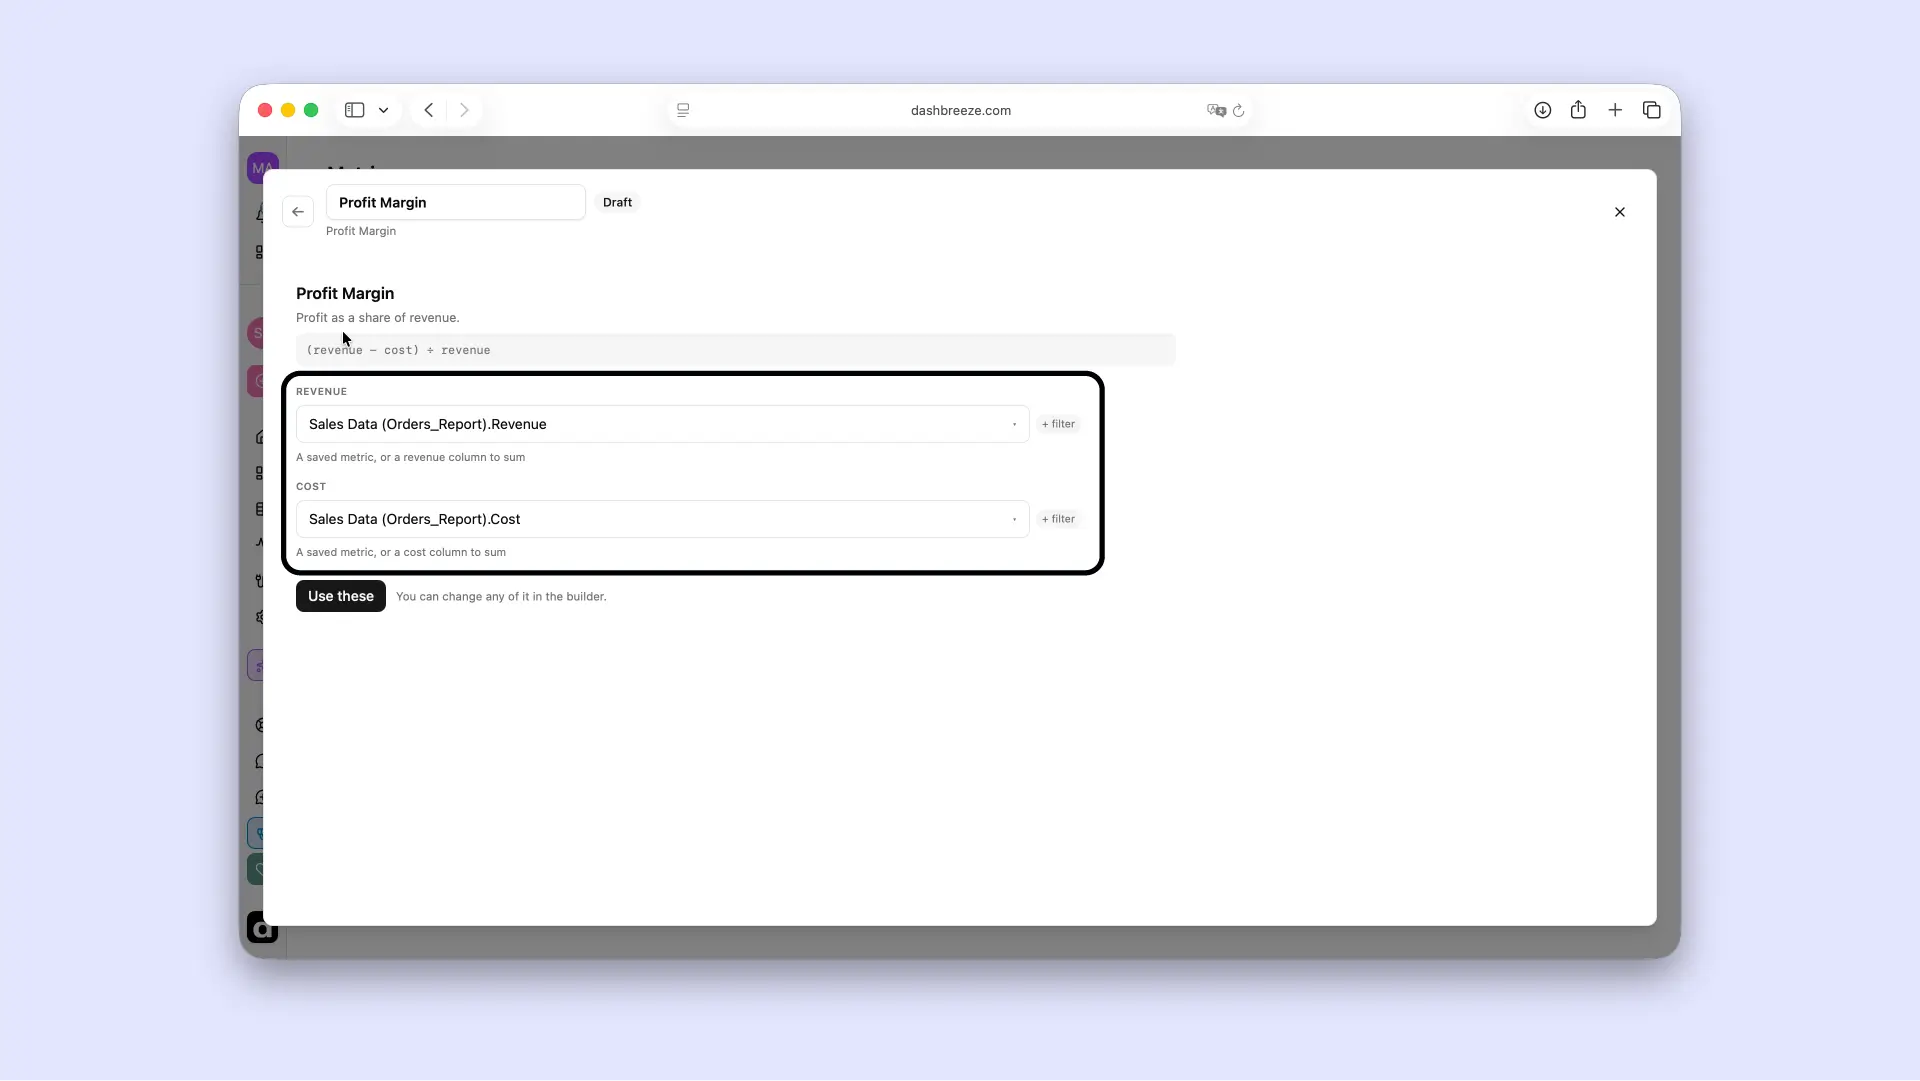
Dashbreeze builds the formula and opens it in the builder — every piece is still yours to change if you want. Check the live result, confirm Checks shows Ready, then select Save metric.
A formula is built from four kinds of pieces, mixed in whatever order the calculation needs:
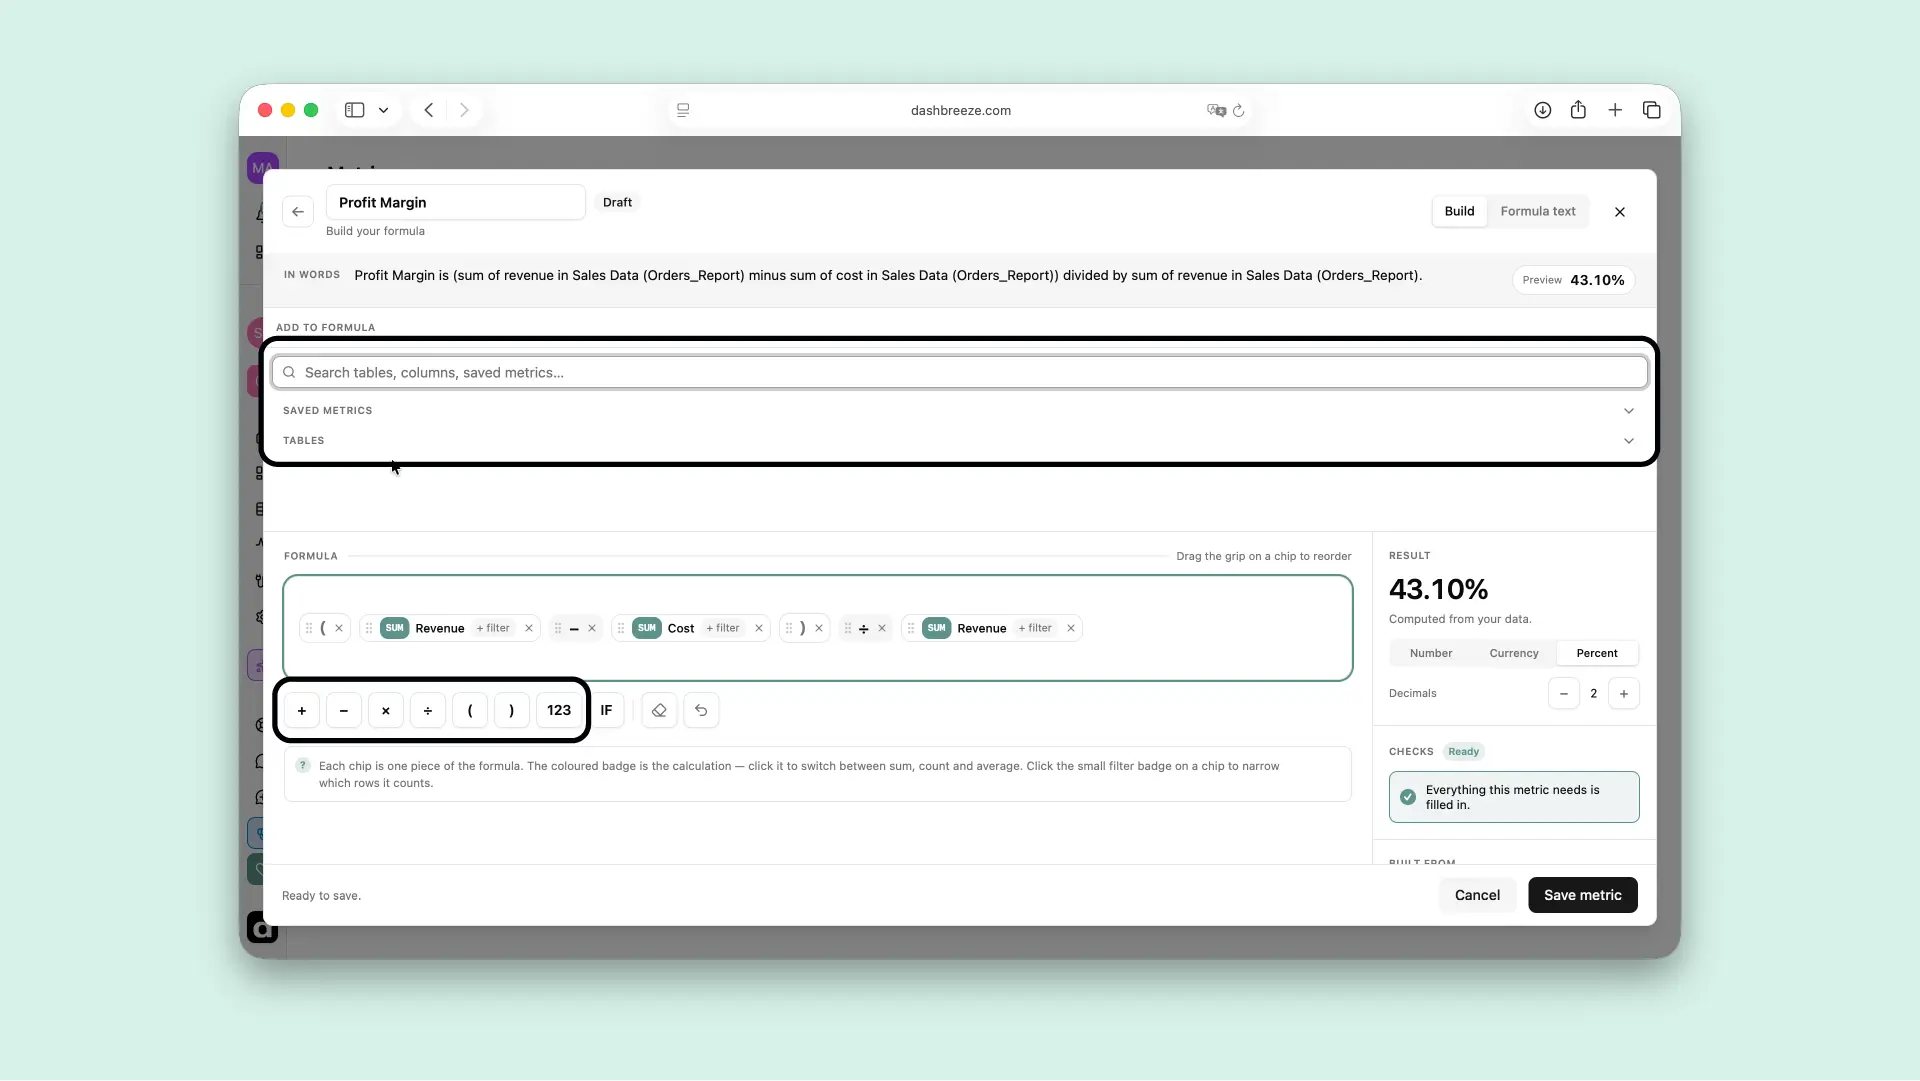
Table columns
Add a column, then pick how to calculate it — Sum, Mean, Count, Count Distinct, Minimum, or Maximum.
Saved metrics
Reuse a metric that already exists in your workspace instead of rebuilding its calculation.
Operators
Add, subtract, multiply, or divide values. Use parentheses when part of the formula needs to run first.
Fixed numbers
Type a target, percentage, multiplier, or any other number straight into the formula.
Order matters:Multiplication and division run before addition and subtraction. For profit margin, use (Revenue − Cost) ÷ Revenue so Dashbreeze subtracts the cost first.
A filter applies only to the table-column chip where you add it — calculate Sum of Revenue where Channel contains Website, or compare this month's revenue with last month's.
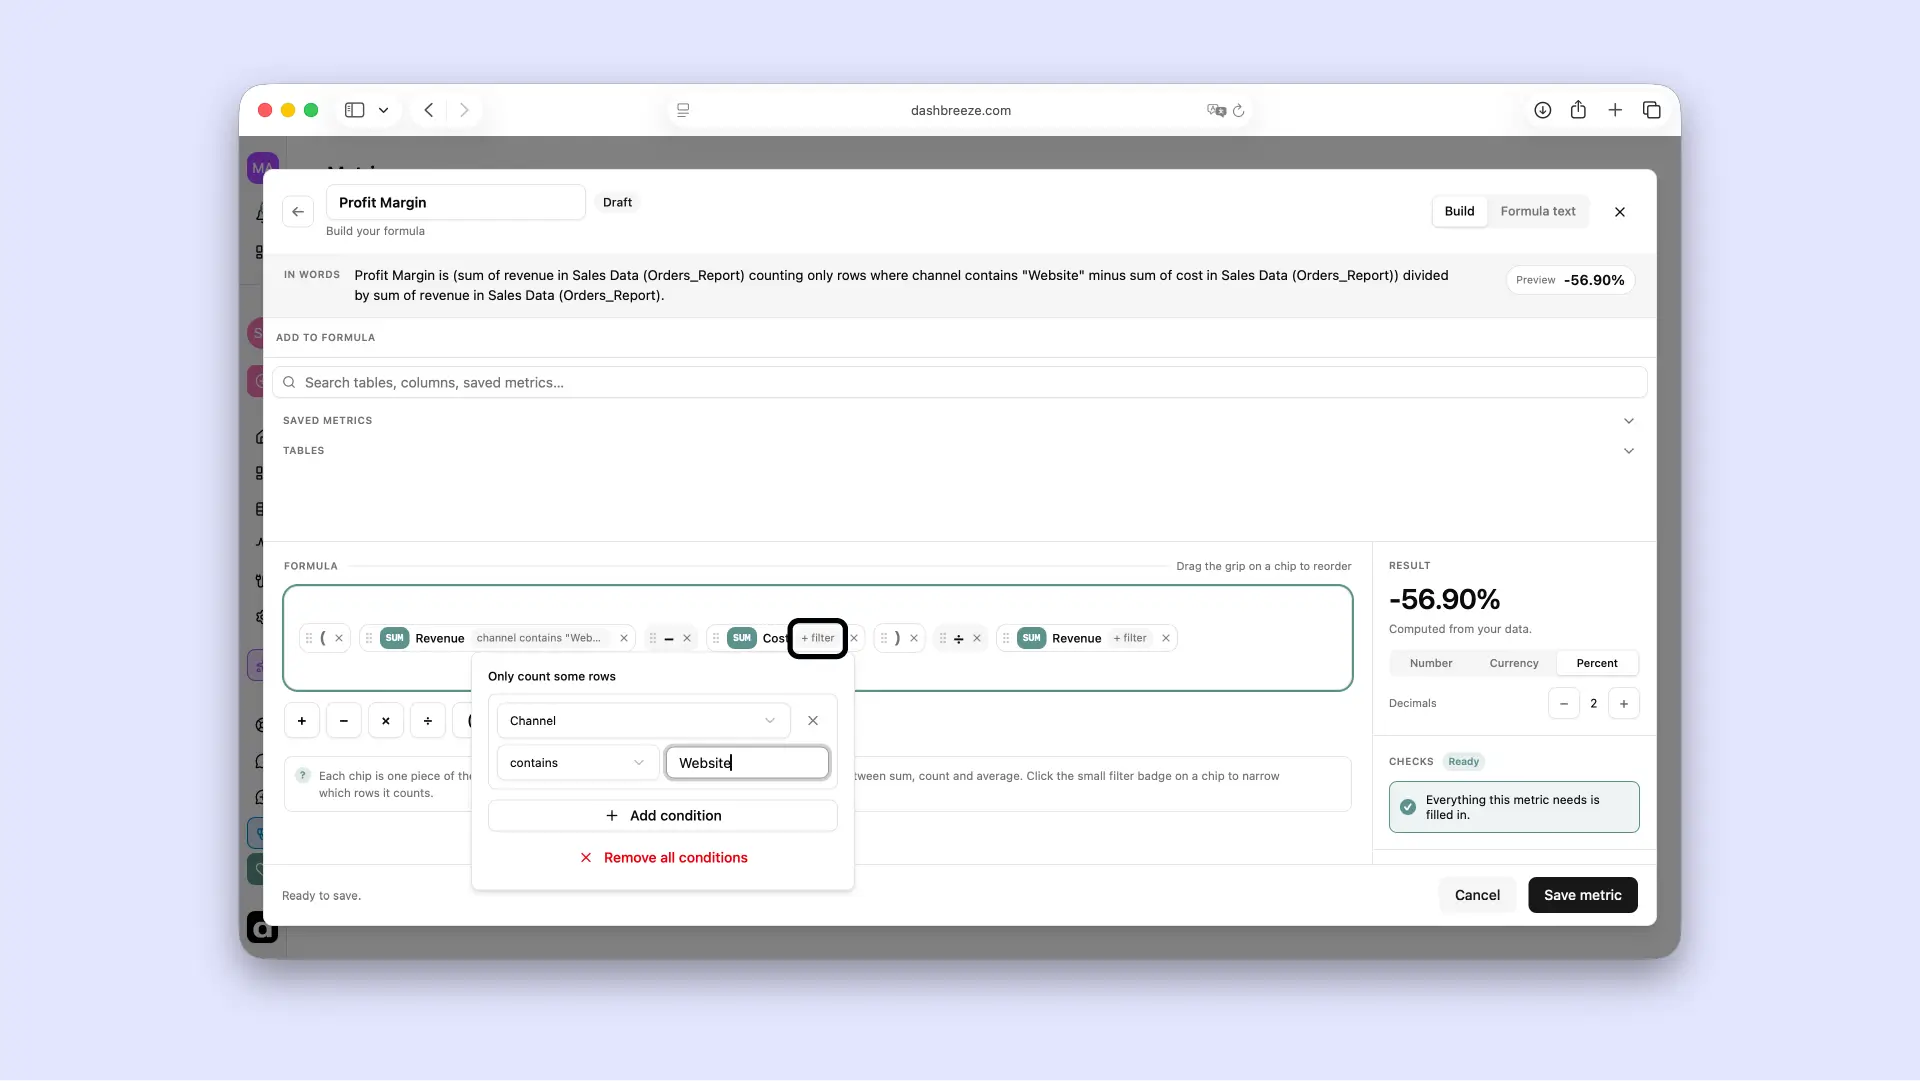
When a filter has more than one condition, choose how they combine:
Use IF when a metric should return different values depending on a condition — if Revenue is less than 2000, return 1; otherwise, return 0.
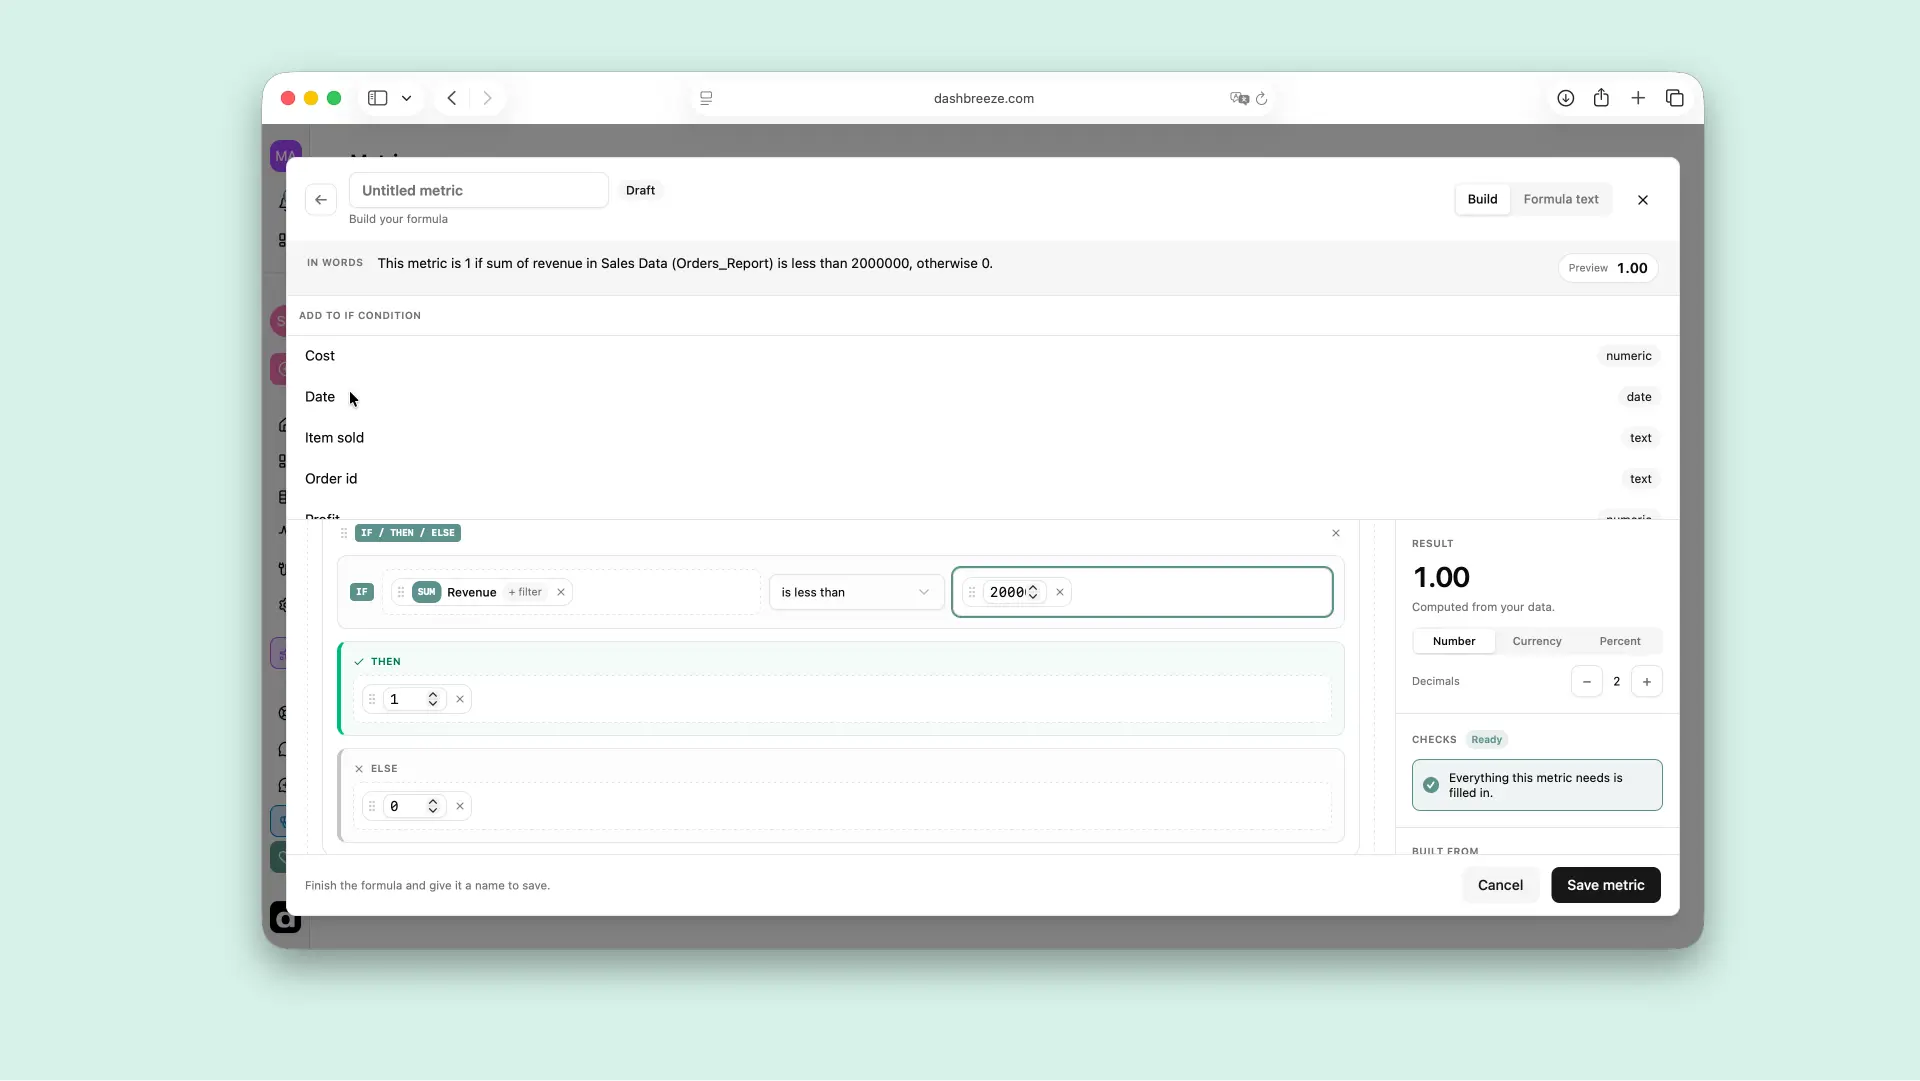
IF conditions cannot be nested:You cannot place another IF inside an IF condition or its branches. Finish the IF, then combine its result with other formula pieces.
Prefer typing? Open the Formula text tab, edit the formula, then select Apply to builder to validate it and update the visual formula.
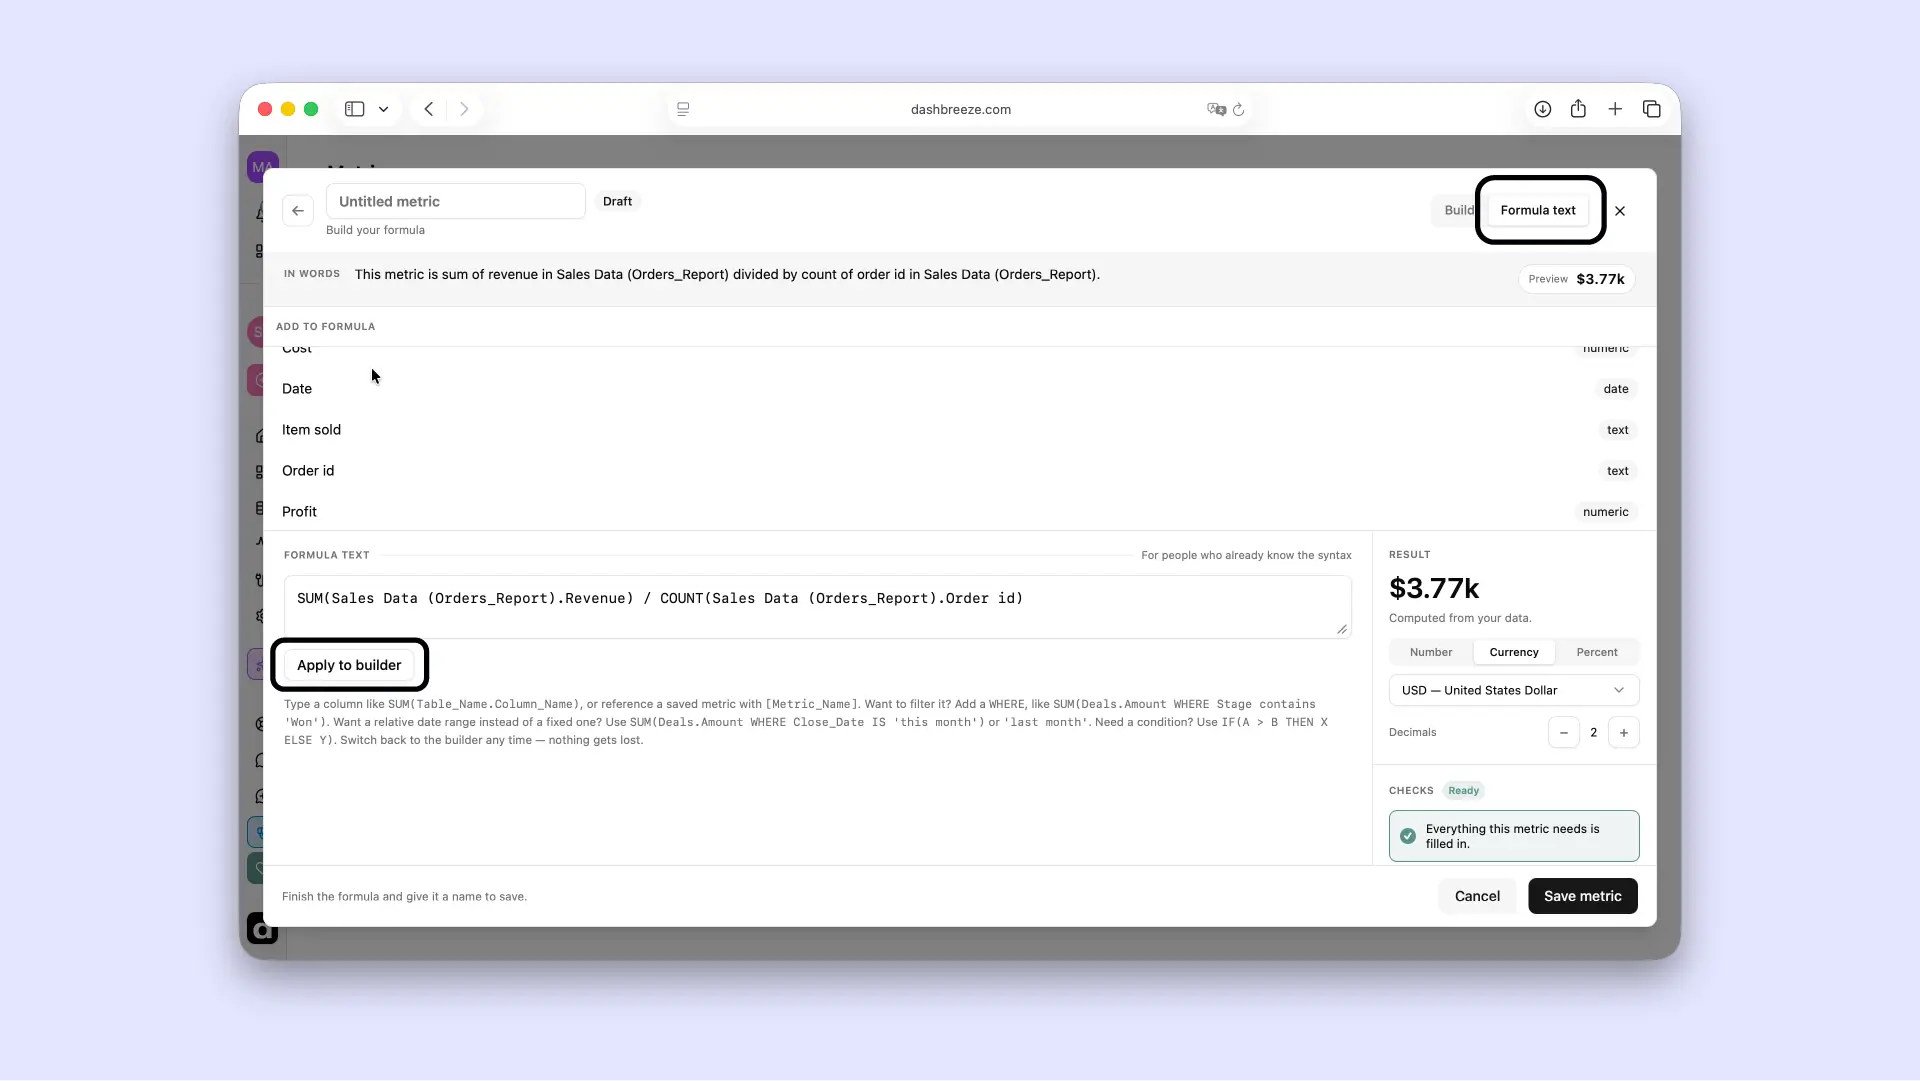
Use exact source names:Table, column, and saved-metric names must match the names in your workspace. Dashbreeze shows what to correct when it cannot read the formula.
Editing changes every connected block:Saving an existing metric updates it rather than creating a copy. Every KPI and Gauge connected to that metric will use the new formula and formatting.