
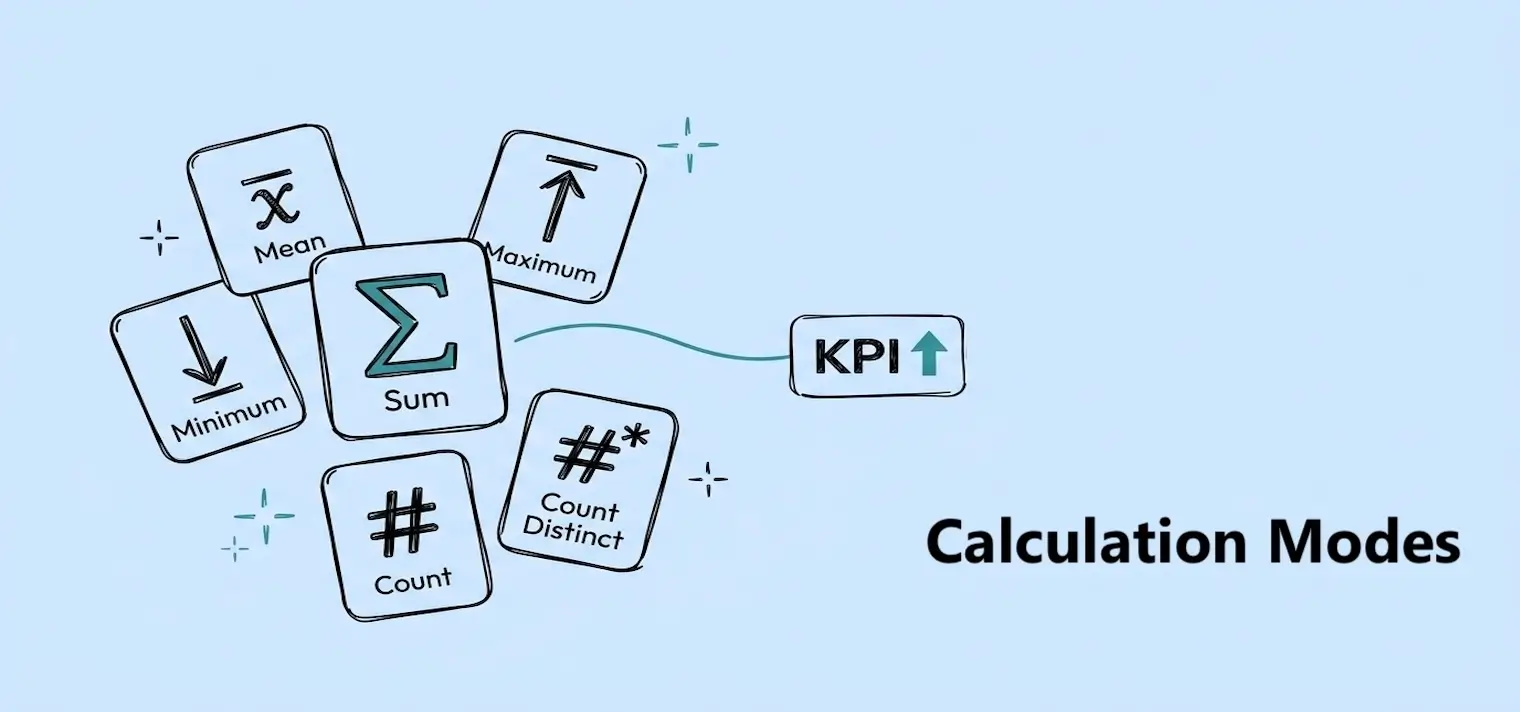
Calculation Modes
Learn what each calculation mode does and when to use Sum, Mean, Minimum, Maximum, Count, or Count Distinct.

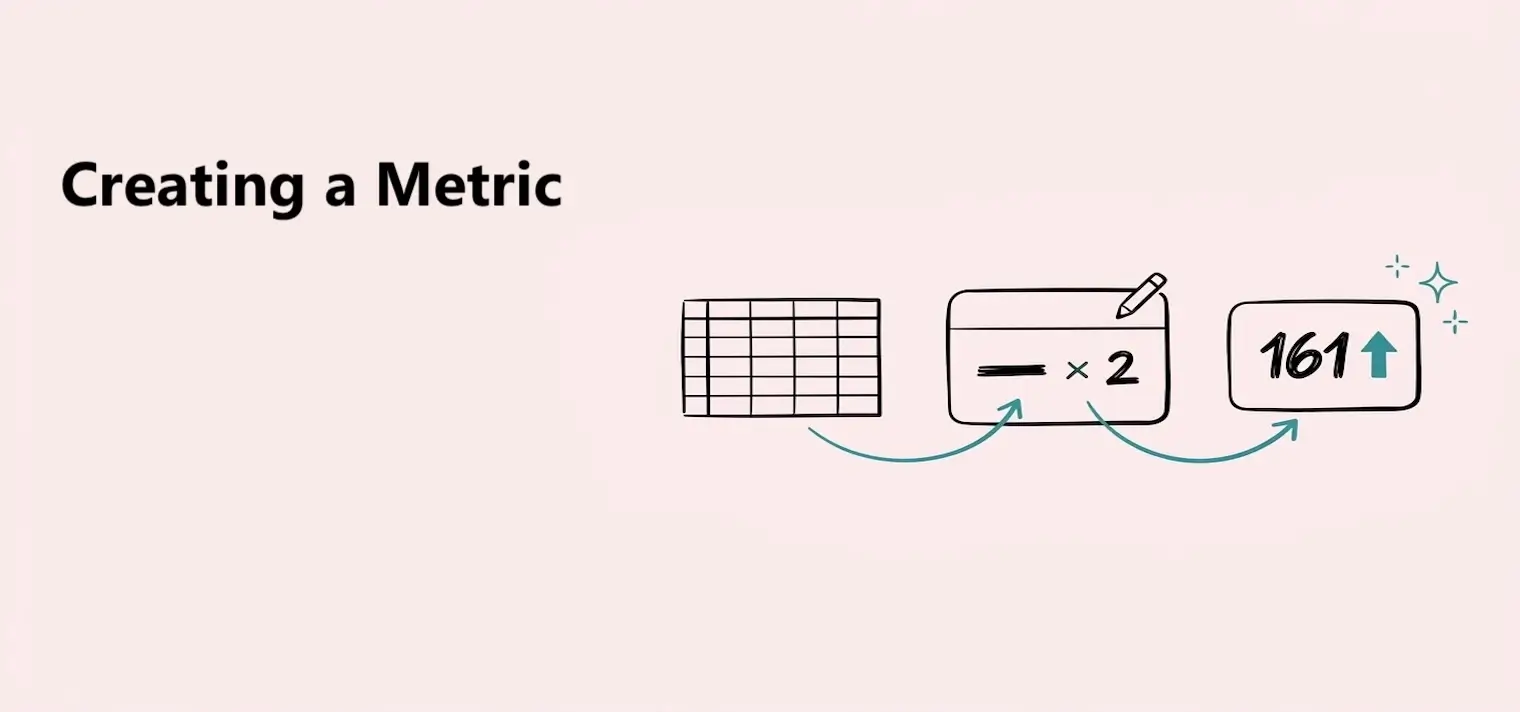
The fastest way to create a metric is right inside the KPI or Gauge that will show it. Pick a table column and a calculation mode, and Dashbreeze turns the table's rows into one number — add a filter if only some of those rows should count.
Before you start, the data you want to measure needs to already be sitting in a table in your workspace.
This metric belongs to the block:A metric created this way is stored inside that KPI or Gauge. It updates with the connected table data, but it does not appear on the Metrics page and cannot be selected by another block.
Both give a KPI or Gauge its number. What's different is where the calculation lives and whether you can reuse it — here's how to choose:
Create inside the block
Reach for this when the number needs just one column, one calculation mode, and maybe a filter. It's the fastest path — set it up and you're done, no separate save step.
Build a custom metric
Reach for this when the calculation needs a formula that mixes columns, tables, saved metrics, or fixed numbers — or when you want to reuse the same number in more than one KPI or Gauge.
Not sure? Start inside the block:You can always switch to the metric builder later if you end up needing to reuse the number or turn it into a formula.
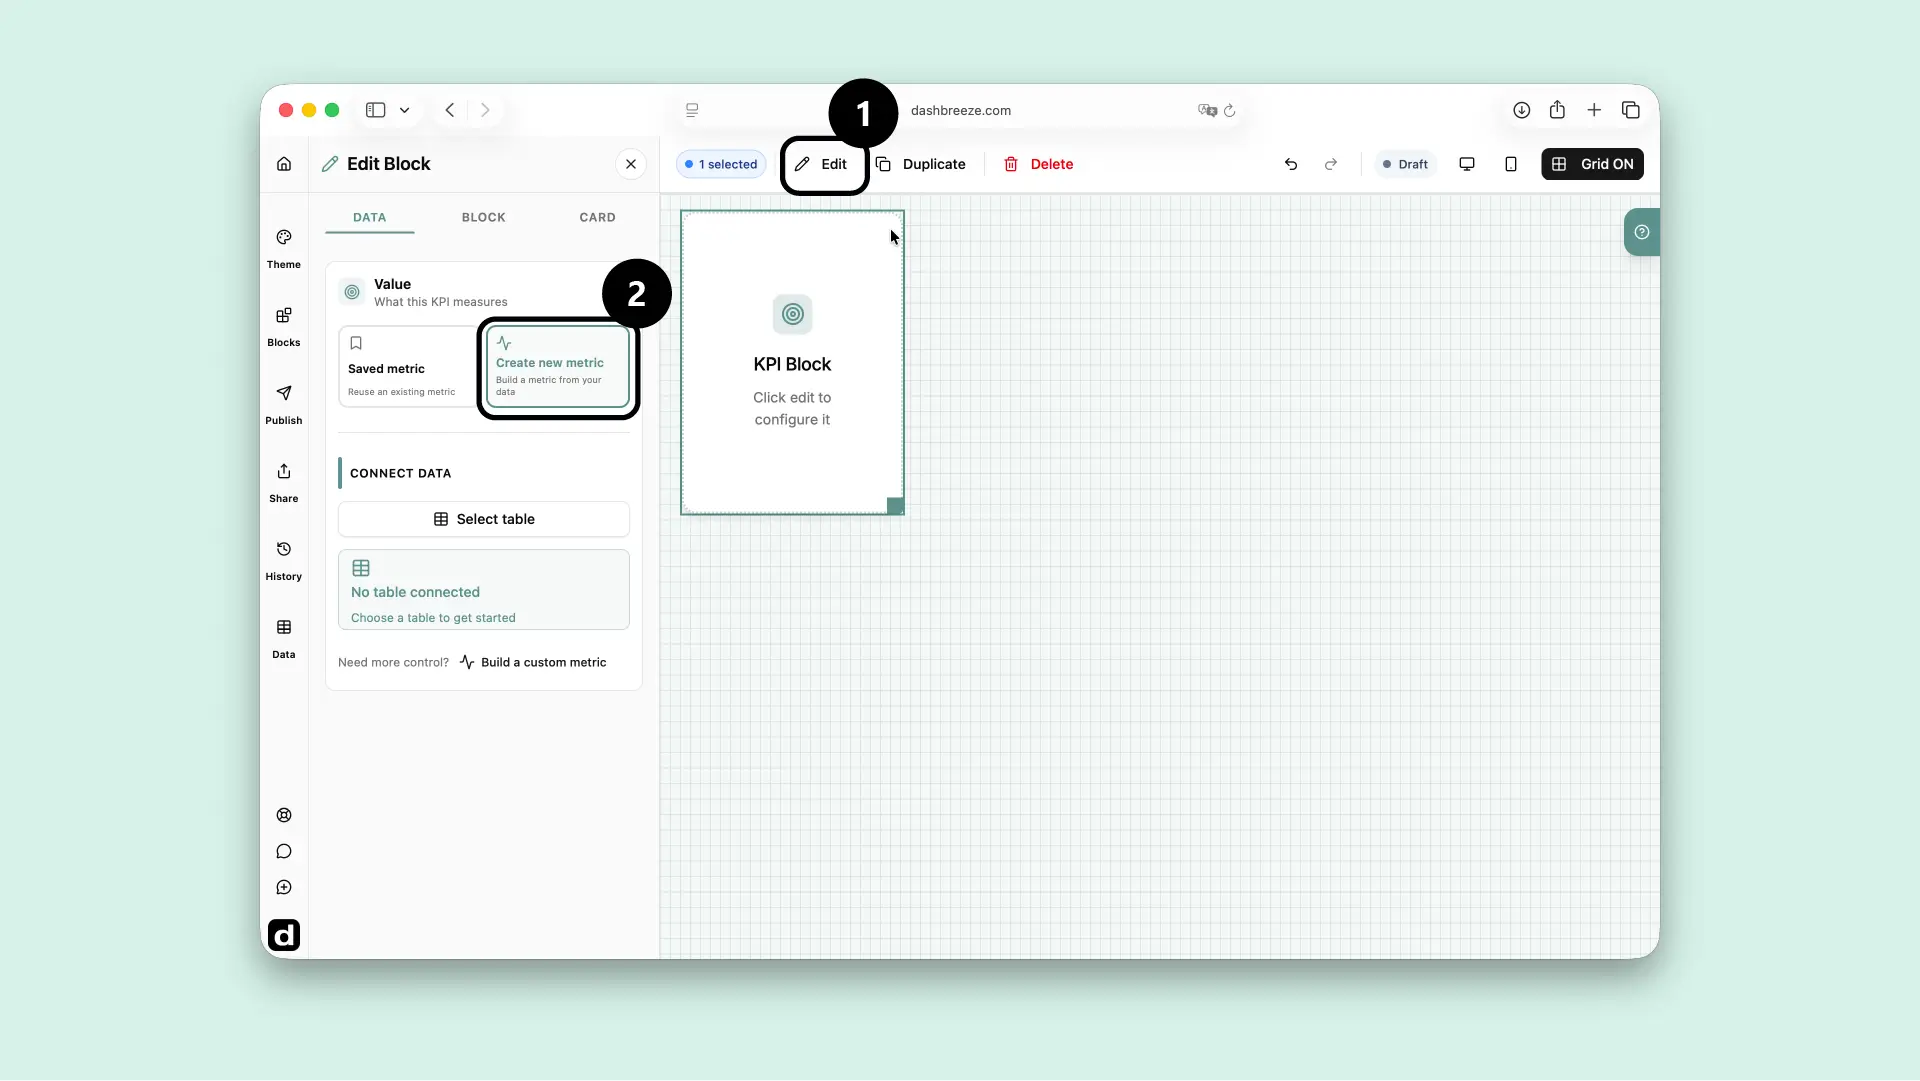
Add a KPI or Gauge to a dashboard, or select an existing one, and open its Data settings. Under Value, select Create new metric.
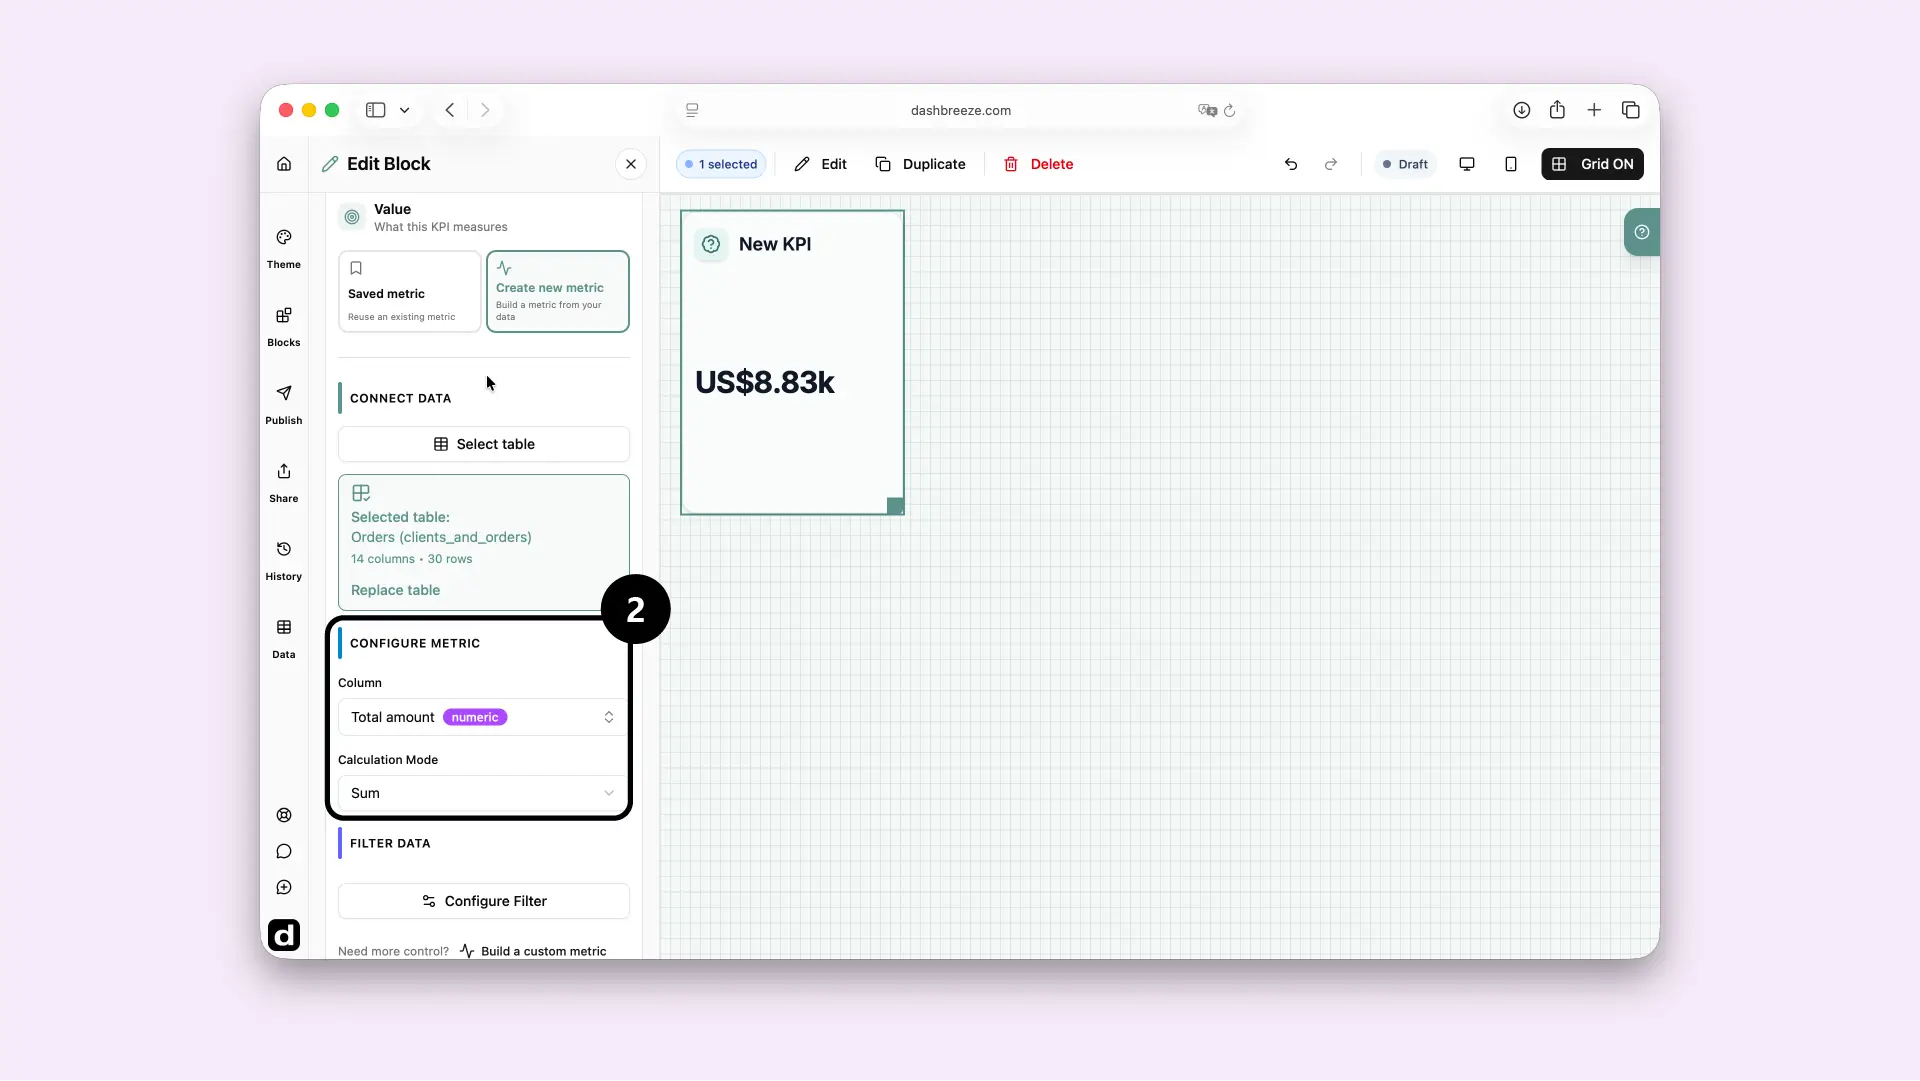
Select the table that holds what you want to measure — an Orders table for total revenue, average order value, or order count. The metric uses that table's current data and recalculates whenever it changes.
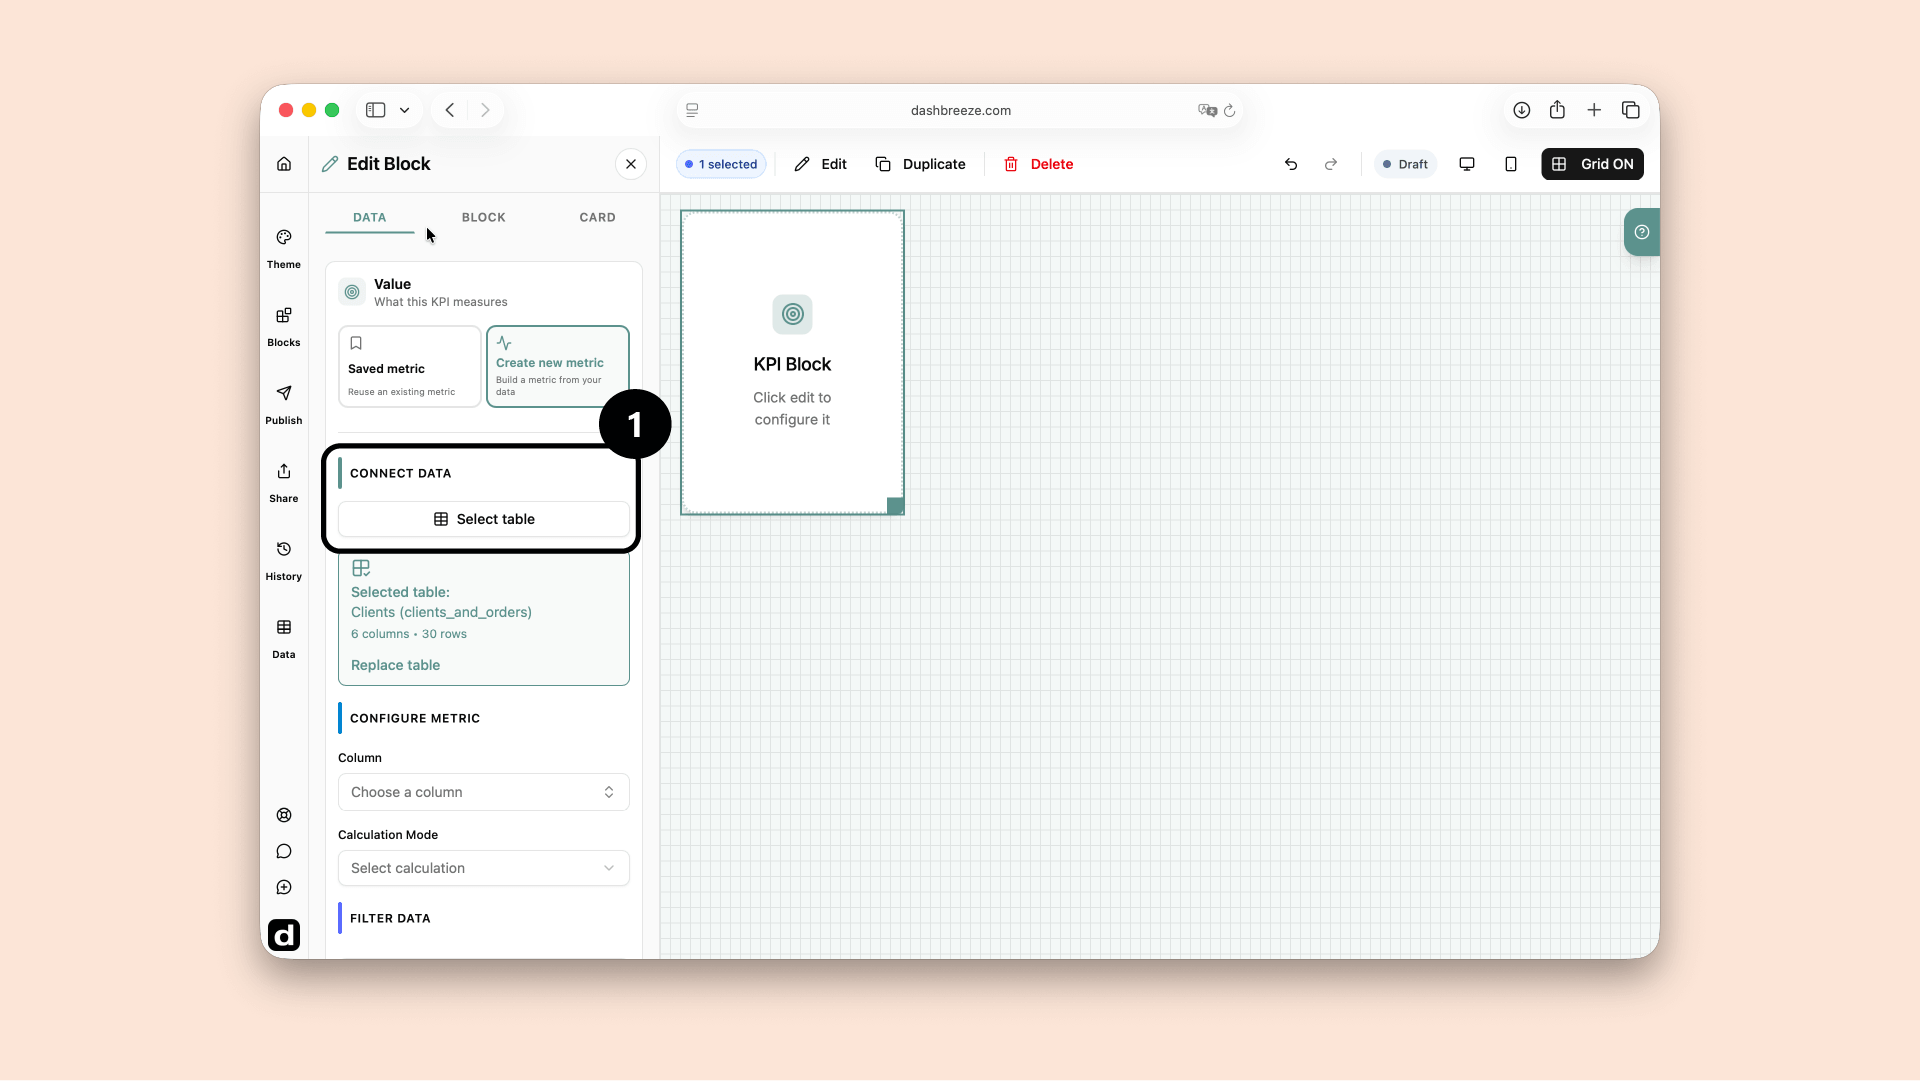
Choose the column you want to measure — Revenue for a monetary result, Customer ID to count customers, or Created Date to count records with a date. The column's type decides which calculation modes are available.
Choose a calculation mode: Sum for a total, Mean for an average, Count for the number of records, or Count Distinct when repeated values should count only once.
Add a filter if you want — it's optional. Use it when the metric should only calculate part of the table, like total revenue where Region equals Europe. It affects only this metric; the table and other blocks stay untouched.
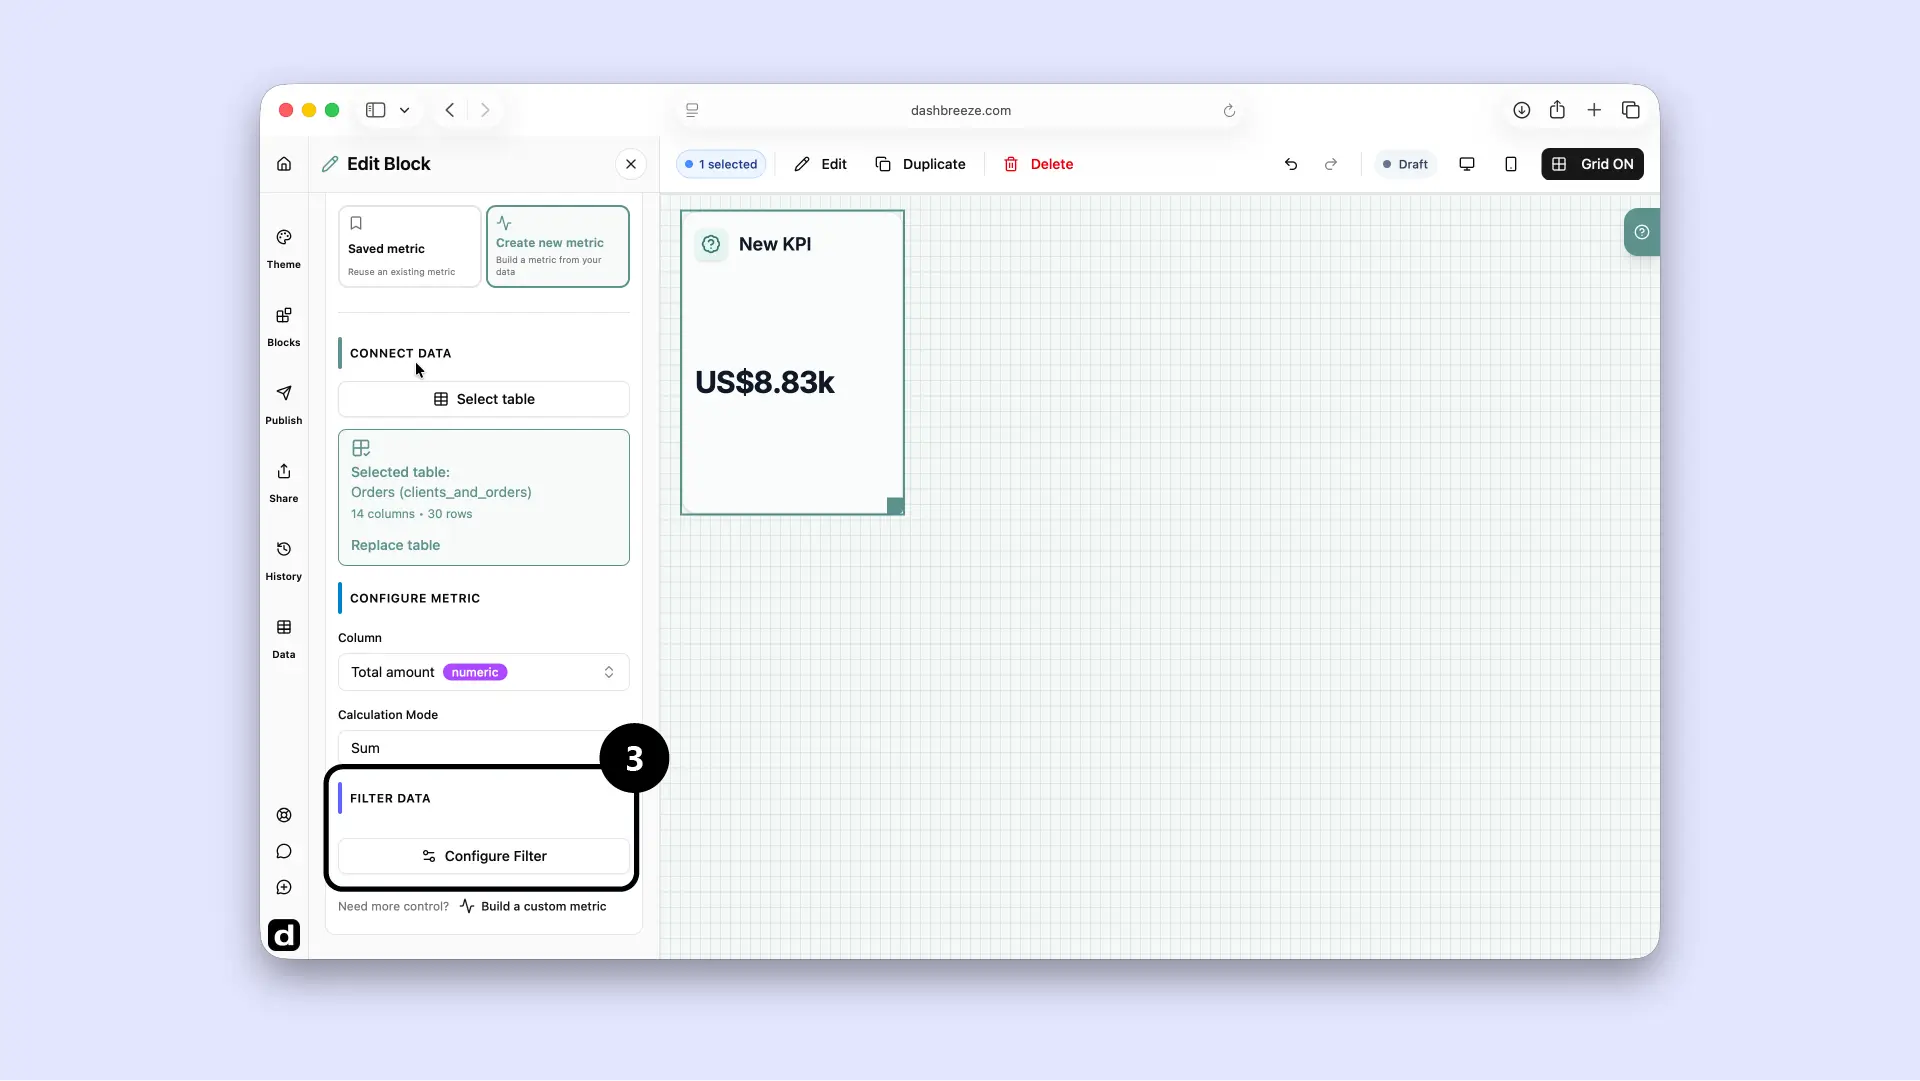
Check the result. The KPI or Gauge shows the calculated number as soon as the settings are complete — confirm the column, calculation mode, and filter add up to the number you expected. There's nothing extra to save: the metric stays part of the block and updates as the table changes.
The metric controls the number:The metric determines which number the KPI or Gauge calculates. The block's title, colors, typography, and other visual settings are configured separately in the block settings.
Select the KPI or Gauge and go back to its Data settings. Change the table, column, calculation mode, or filter whenever you want — since the metric belongs to this block, your changes only affect this KPI or Gauge.
Reach for the metric builder when you need to combine columns, calculations, saved metrics, or fixed numbers in a formula. A metric built there is saved to your workspace, so any KPI or Gauge can use it.