
Creating a Metric
Create a simple metric inside a KPI or Gauge by selecting a table column, calculation mode, and optional filter.


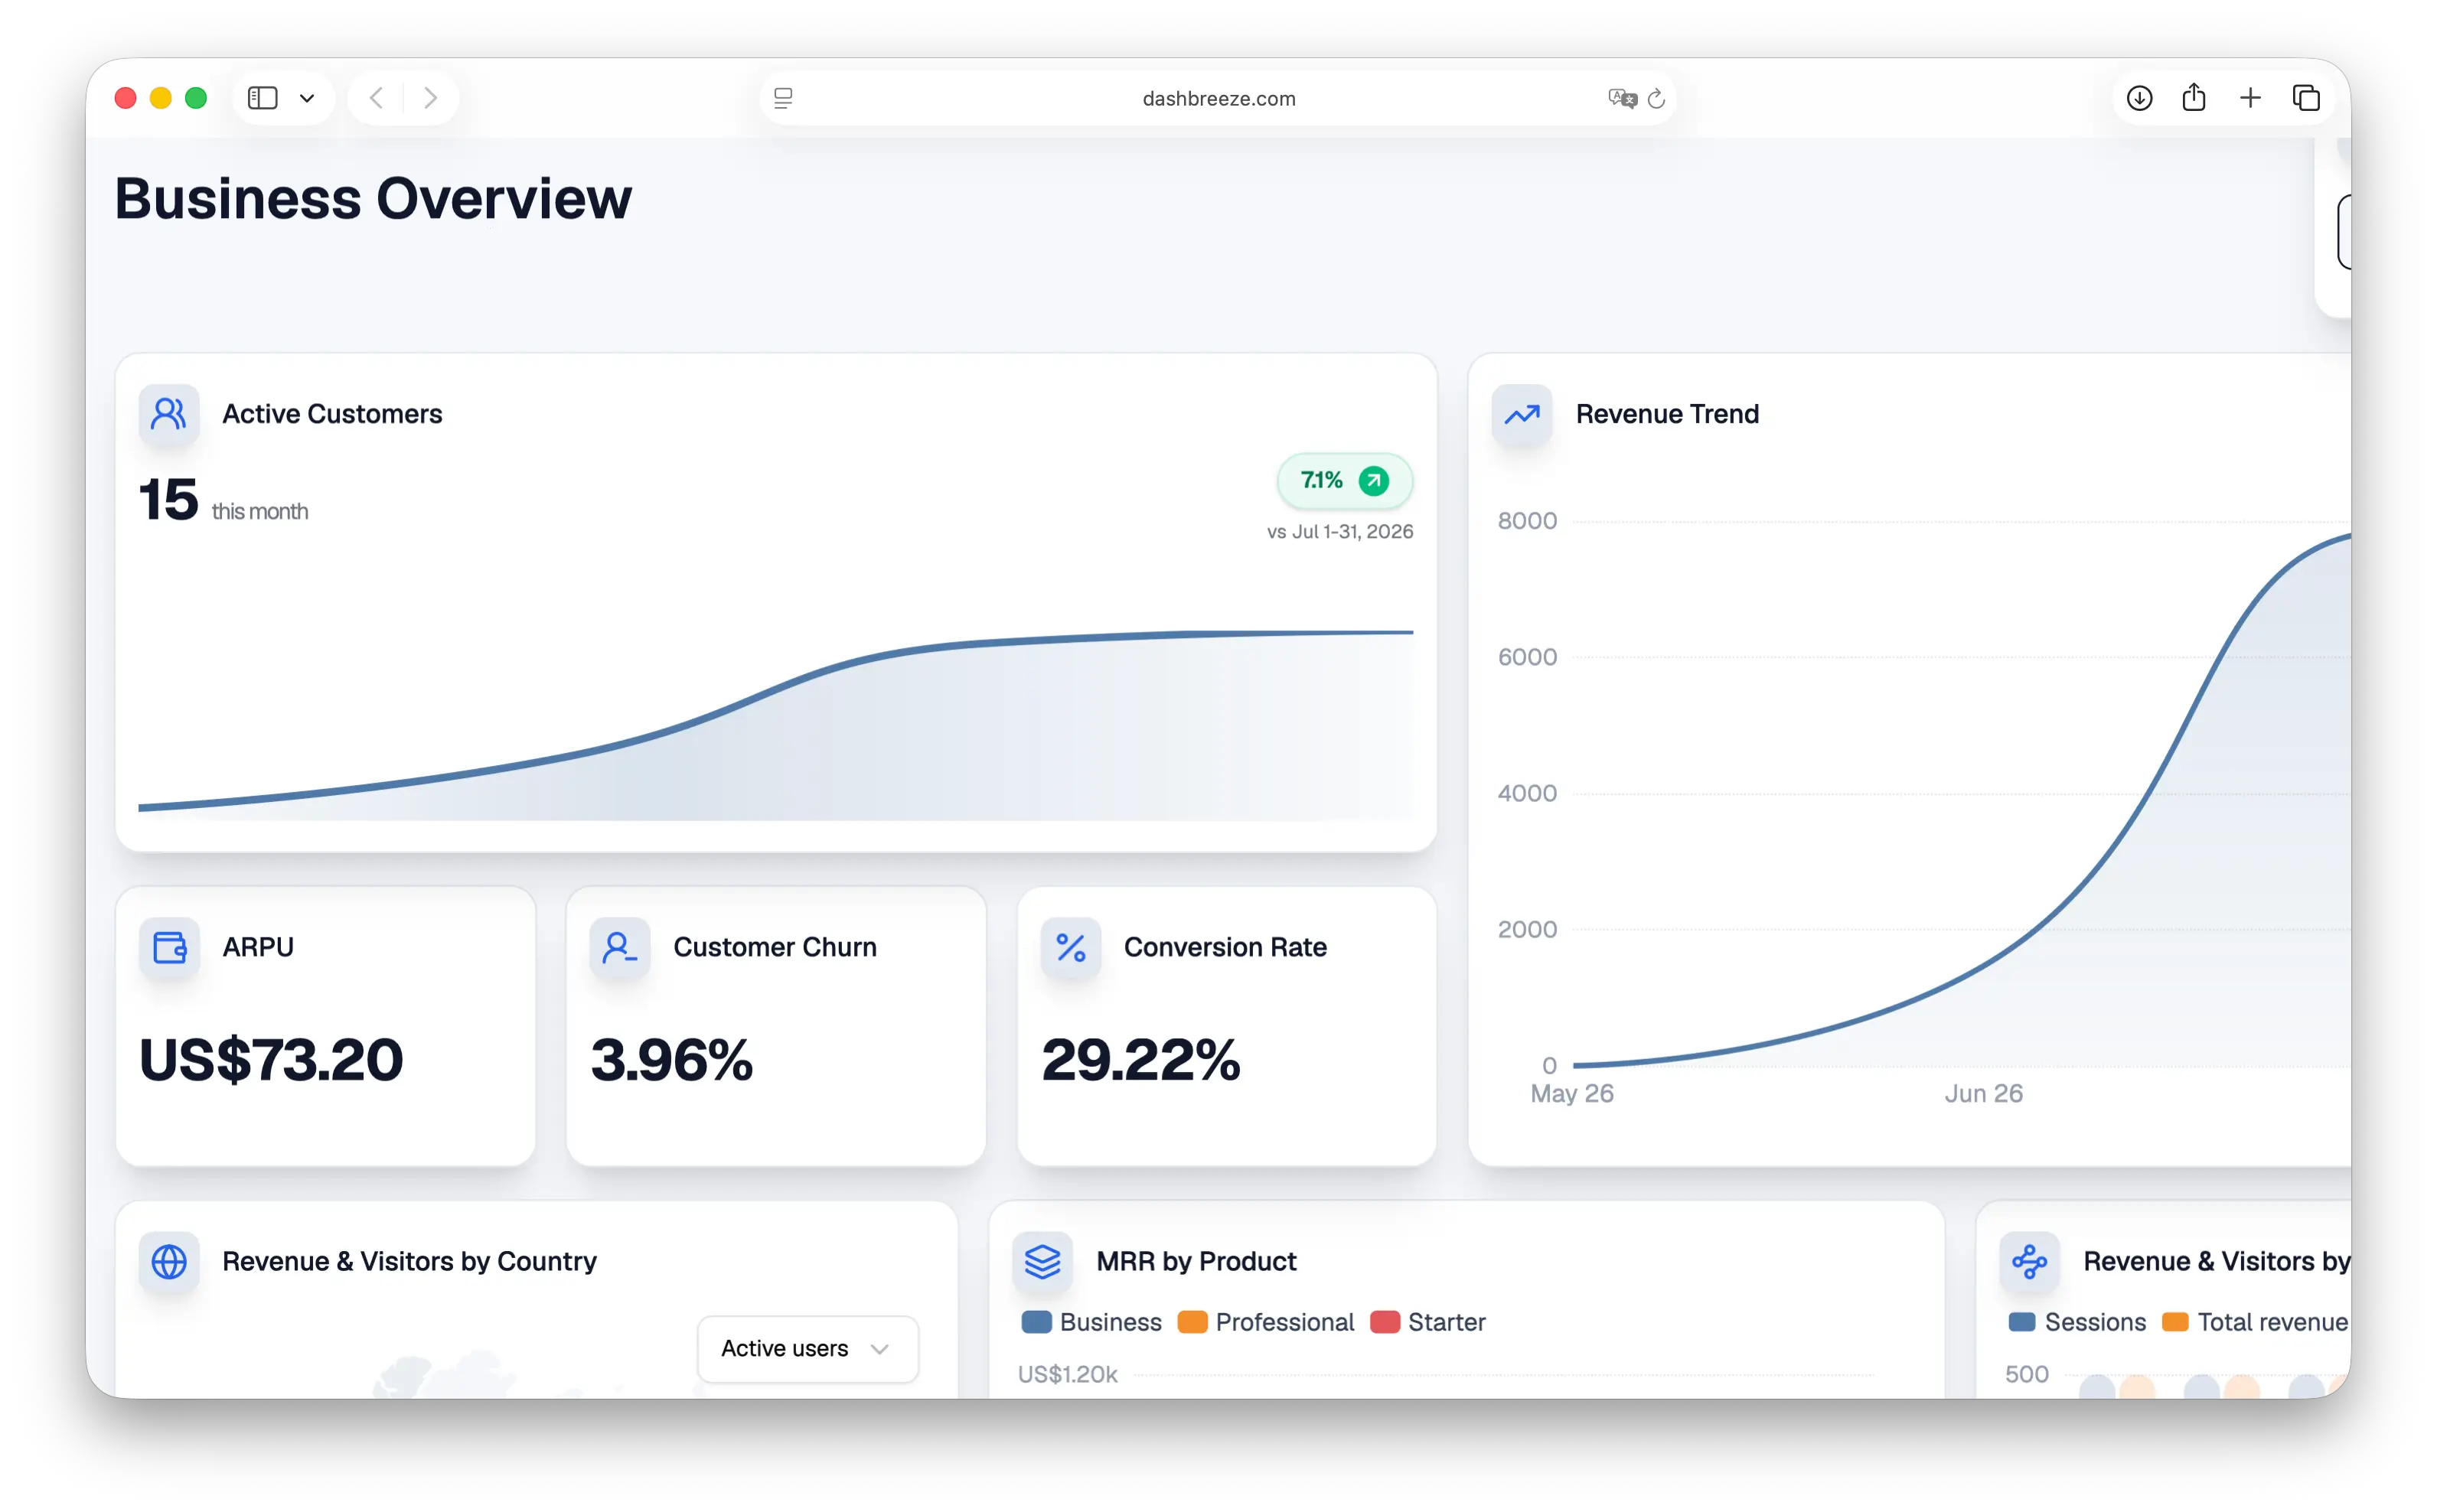
A metric is a single number that sums up your data — total revenue, average order value, customer churn, conversion rate. It's the number behind every KPI and Gauge block.
Instead of scanning rows in a table, you get one clear number to check at a glance. Connect a metric to a table and it stays live: change the data, and the metric recalculates automatically.
Total revenue
Adds every value in the Revenue column, so you know how much revenue you're generating.
Average order value
Averages the Order value column, so you know how much customers typically spend.
Customer churn
Divides customers lost this period by customers you started with, so you know how many you're losing.
Every metric starts with a column from one of your tables. From there, three things shape the final number:
A KPI or Gauge can get its number in three ways. Here's the difference:
Manual value
Type a fixed number directly into a Gauge, like a target of 100. It's not calculated from your data, it belongs only to that block, and it only changes when you edit it.
Metric created inside a block
Calculate a number from a table column, right inside the KPI or Gauge. It updates automatically with your data, but it's locked to that one block — you can't reuse it elsewhere.
Metric created in the metric builder
Build and save a metric to your workspace, from a simple calculation or a full formula. Reuse it across as many KPI and Gauge blocks as you want — edit it once, and every connected block updates.