You have the data. Now get the answers.
Connect your business data, ask questions in plain language, and understand what is changing, why it is happening, and what to do next.
Conversational analytics
Your data isn't just
numbers.
Your business data has a story behind it. Ask what changed, why it happened, what stands out, and what deserves your attention — like having a conversation with your business.
Business health dashboard
Ask a follow-up…
Answers are generated from workspace data and may need verification.
Don't just read the numbers
Ask what changed, what's unusual, and what the numbers mean for the business.
Follow the conversation
Every answer can become another question. Keep digging until you understand what's really happening.
See it when words aren't enough
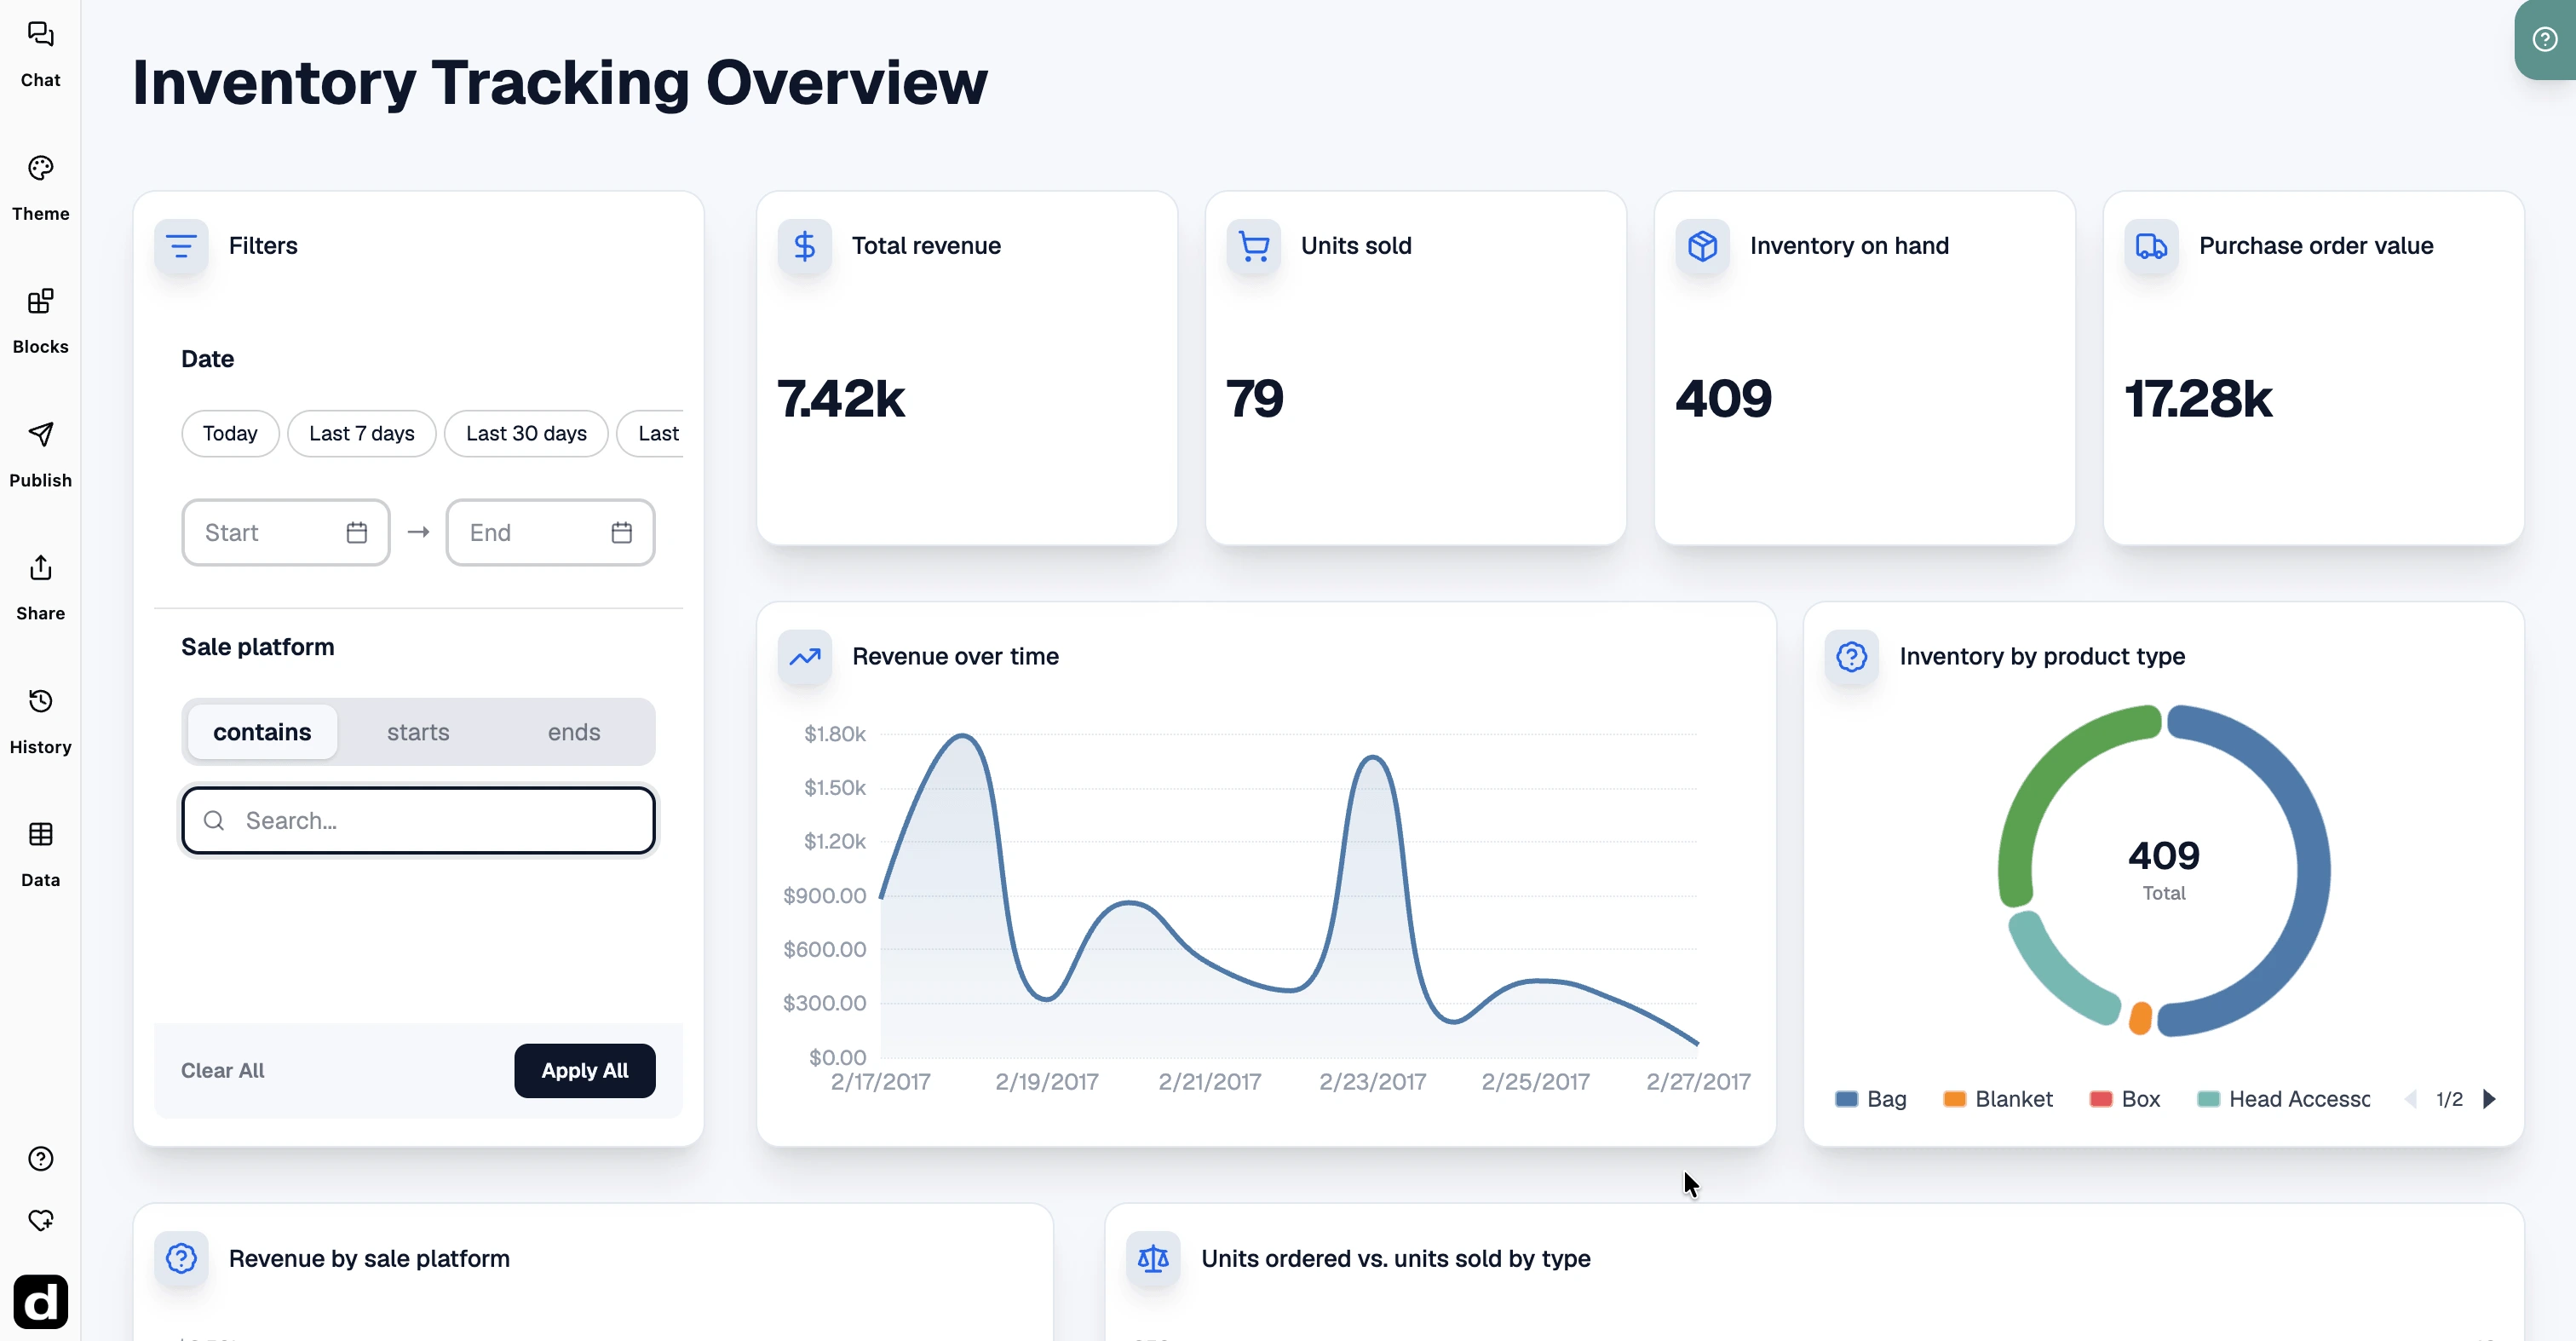
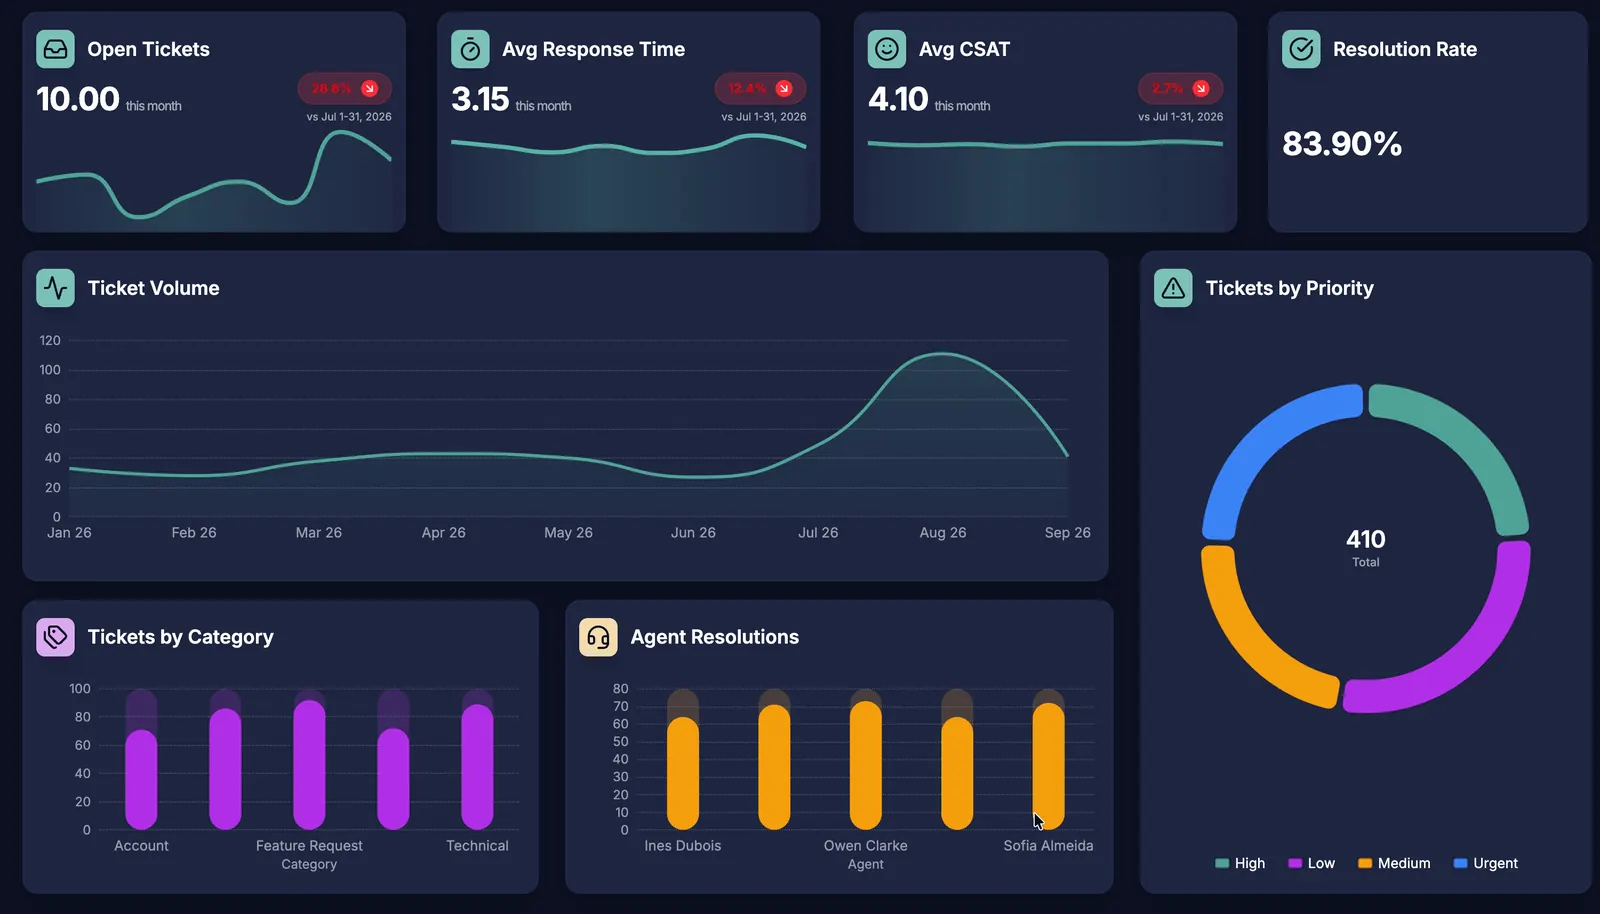
Dashbreeze can bring in metrics, charts and dashboards whenever they make the answer easier to understand or present.
Start with a question.
Let the conversation take it from there.
STEP 1
01Ask what you want to know
Ask a business question in plain language — just like you would ask someone on your team.
STEP 2
02Connect your business
Bring in the spreadsheets, databases, and tools your business already runs on. Dashbreeze keeps supported sources synced automatically.
STEP 3
03Keep digging
Follow up, compare periods, break things down, and ask why. Dashbreeze can bring in charts, metrics, and tables whenever they make the answer clearer.
STEP 4
04Keep it. Share it. Come back to it.
Turn useful analysis into a dashboard, work on it with your team, or share it so other people can explore the data too.
Analyze
Have a conversation
with your business.
Start with what you want to understand. Ask what changed, why it changed, compare it with something else, or keep following the answer until you understand what's happening.
Ask your data
Ask questions about your business data in natural language.
Follow-up questions
Continue the same analysis through a conversation instead of starting over.
AI analysis
Let Dashbreeze analyze the underlying data and explain what it finds.
Visual answers
Get charts, tables and metrics when they help explain the answer.
Connect
Your data already lives
somewhere.
Spreadsheets, business apps, databases or a plain file. Connect what you already use and bring the pieces of your business together in Dashbreeze.








Prepare
Because real data is
usually a little messy.
Work with the data before you analyze it. Clean up columns, combine tables, create metrics, and keep connected sources refreshed without moving everything into another tool.

Sales Data
Google Sheets
Sync Mode
Keep your data up to date
Join another table
Combine Sales Data with another table using matching columns.
Shape your data
Filter, sort, and keep the records and columns you actually need.
Clean it up
Rename columns, fix types, and control how values are displayed.
Combine sources
Bring related tables together using matching columns.
Create and refresh
Build calculated metrics and keep supported sources up to date.
Build & customize
Let AI build it.
Then make it yours.
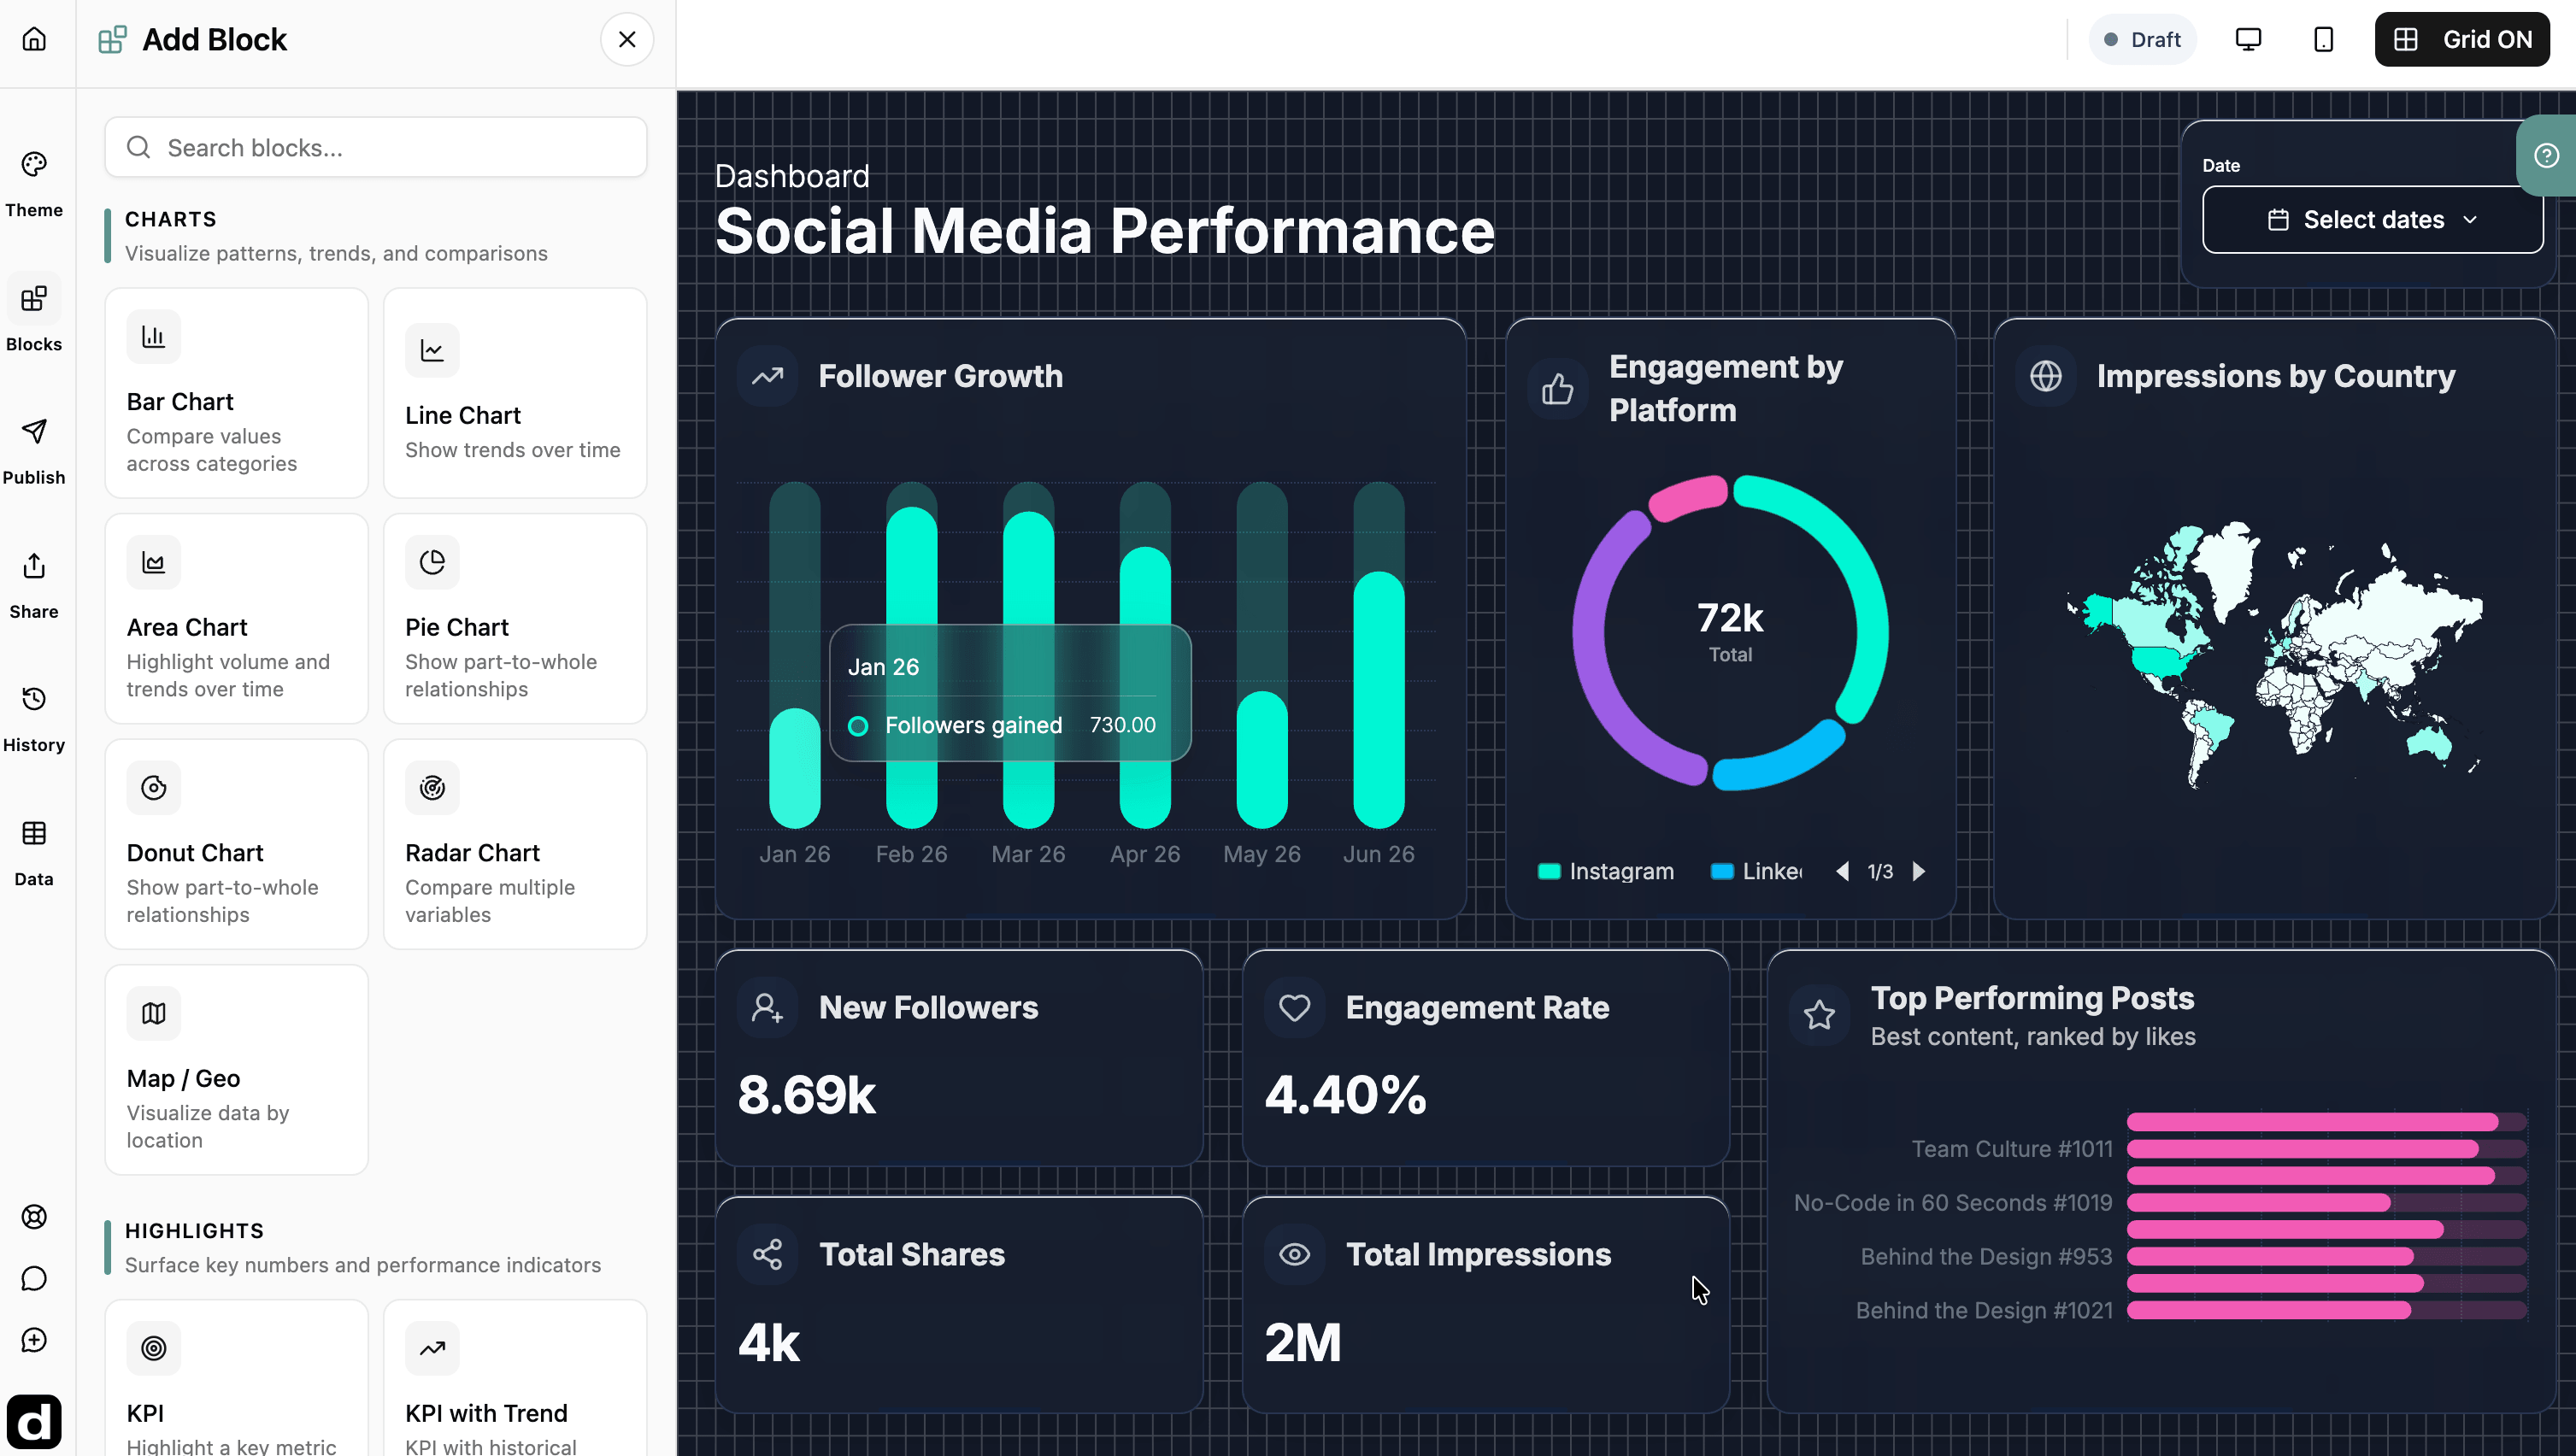
Dashbreeze can create the dashboard for you, but you're never stuck with what AI gives you. Every chart, block, style, filter, and piece of the layout stays editable.
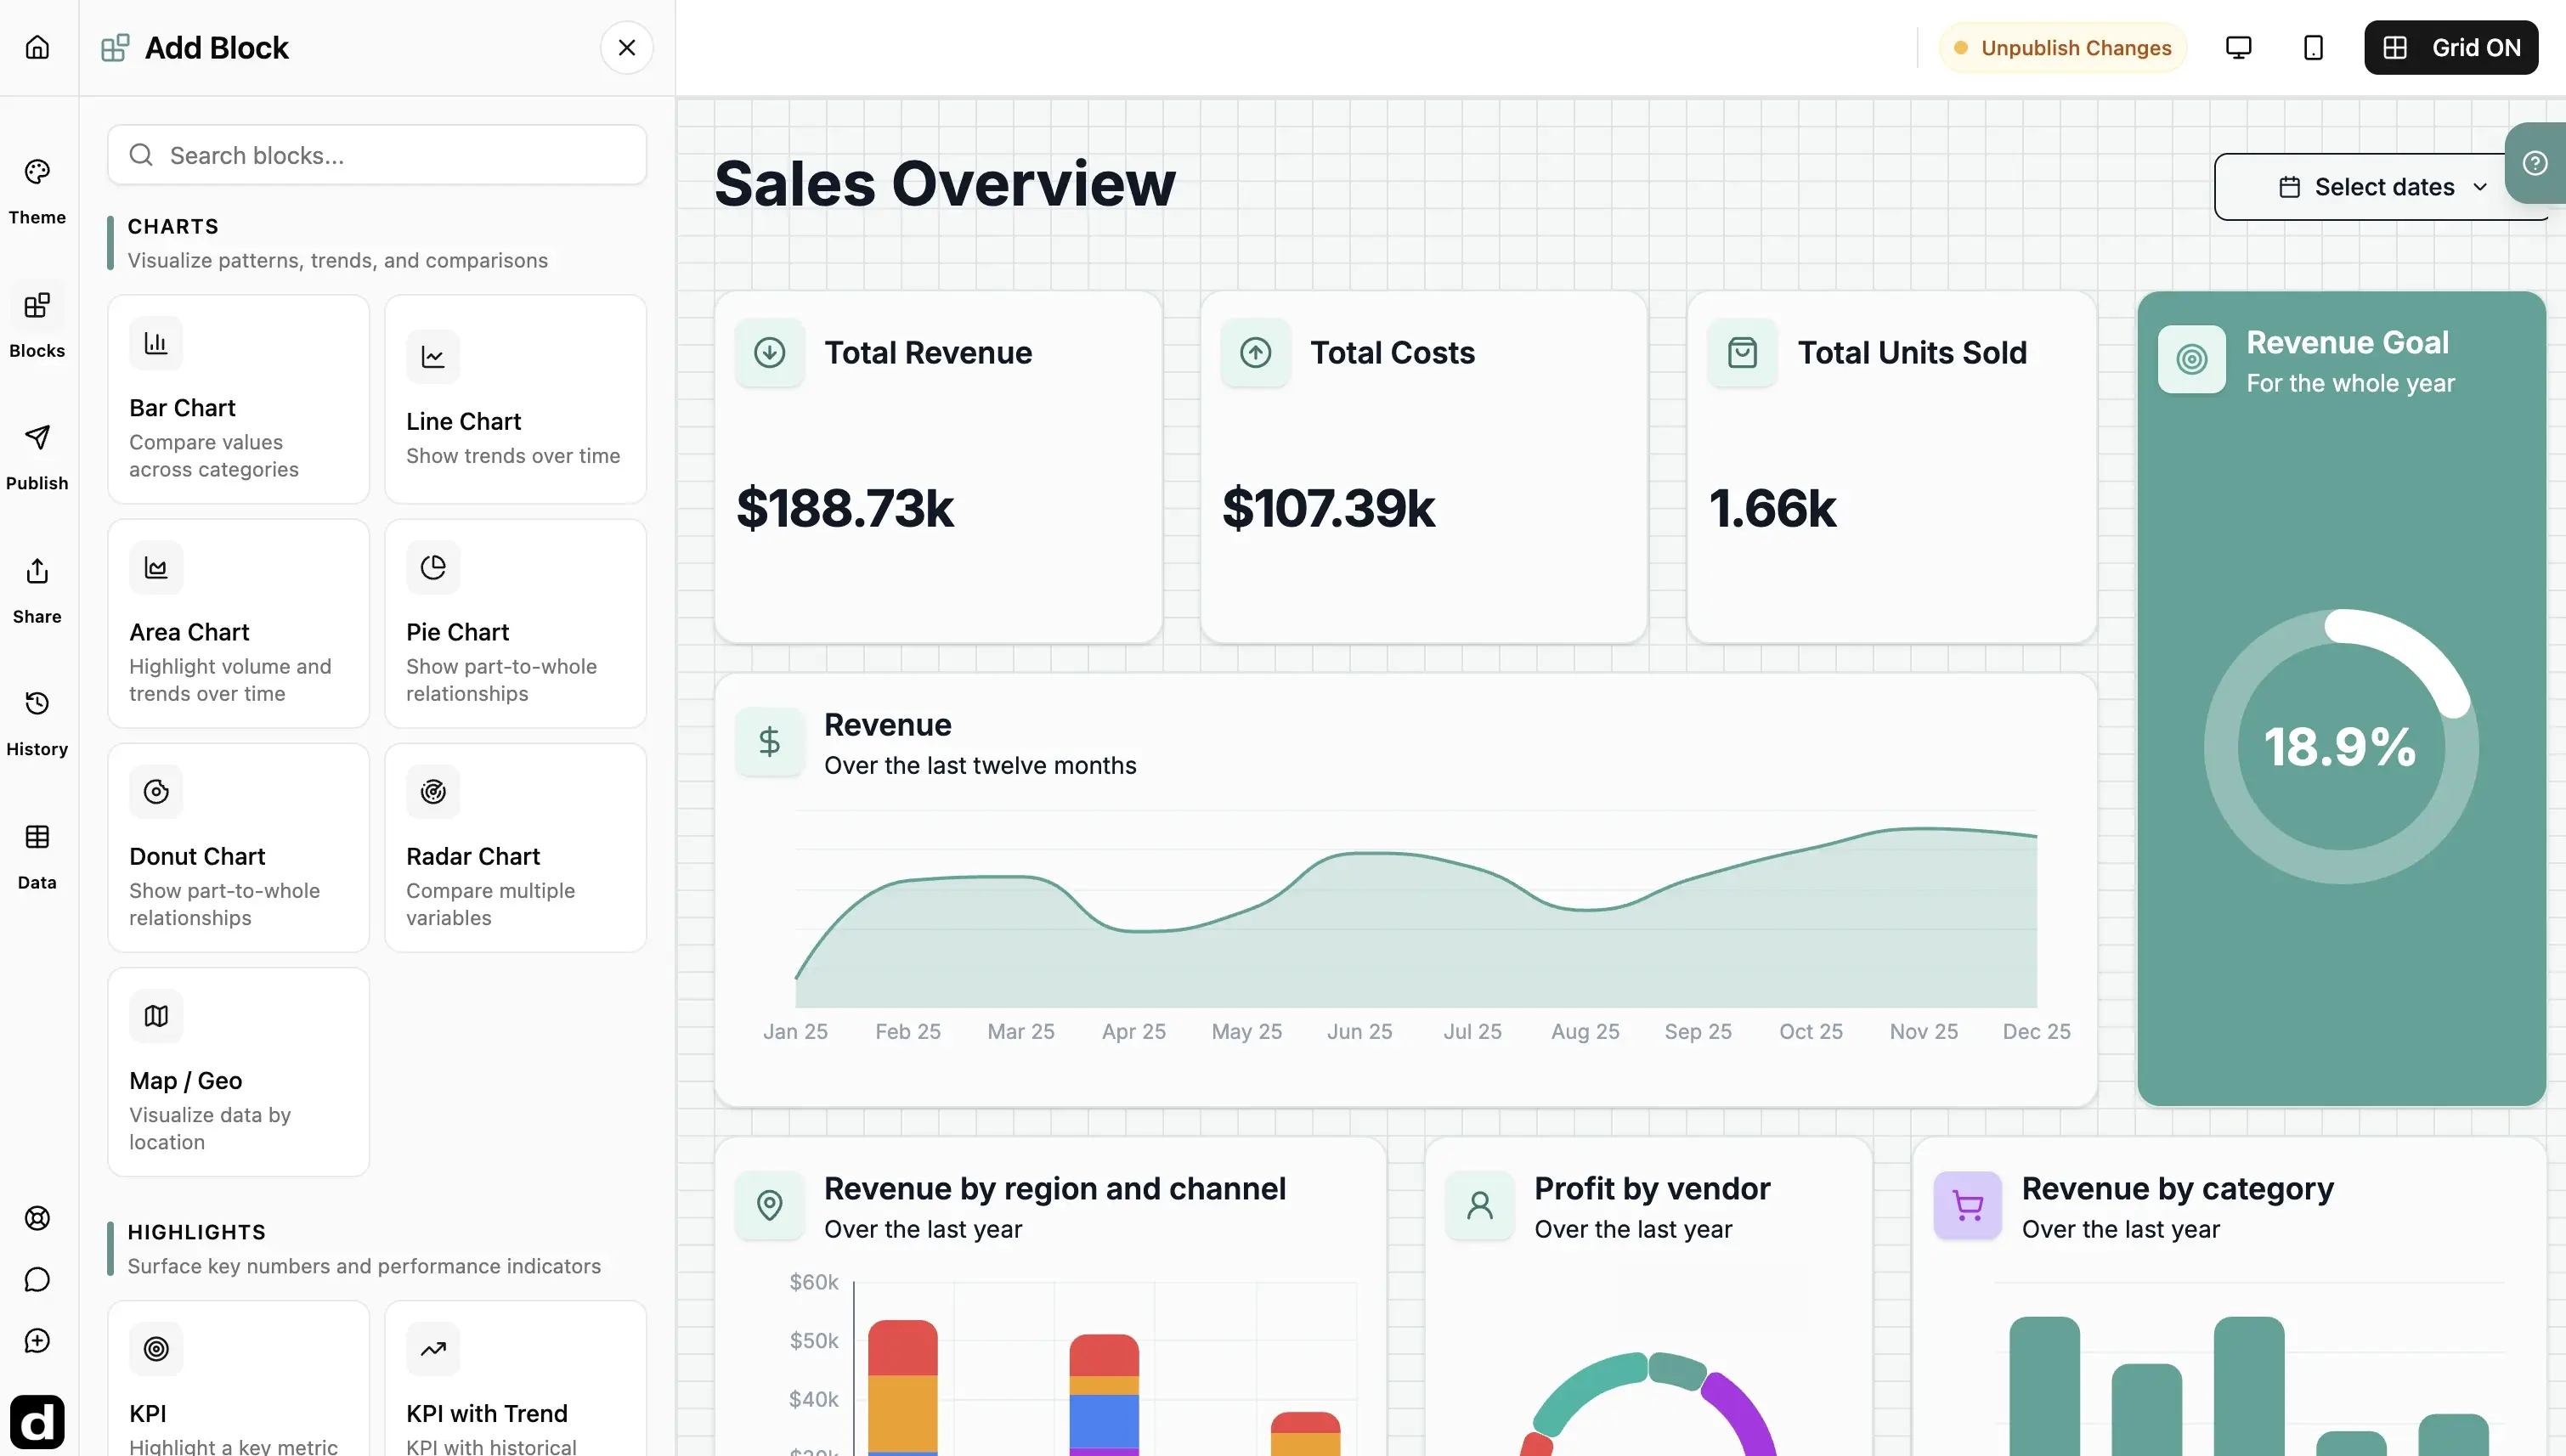
Generate with AI
Create or change dashboard content by describing what you want.
Build the view
Add charts, KPIs, tables, and text to tell the right story.
Make it yours
Customize themes, colors, fonts, cards, and the overall visual style.
Fine-tune every detail
Adjust charts, labels, filters, and block settings as you go.
Workspace
Work on the same business.
Together.
Bring your team into the same workspace. Share dashboards and data sources, and give everyone access to AI so the whole team can work with the same business data.

Team members
Invite other people to your Dashbreeze workspace.
Workspace data
Keep connected data sources available to everyone in the workspace.
Workspace dashboards
Keep dashboards together so the team can work with the same views.
AI for the whole team
Workspace members can ask questions and create charts, metrics and dashboards with AI.
Share
Share the analysis.
Not another export.
Send the live dashboard to your team, a client, or anyone else who needs it. Choose how they get access and give them a clear, live view of the analysis.
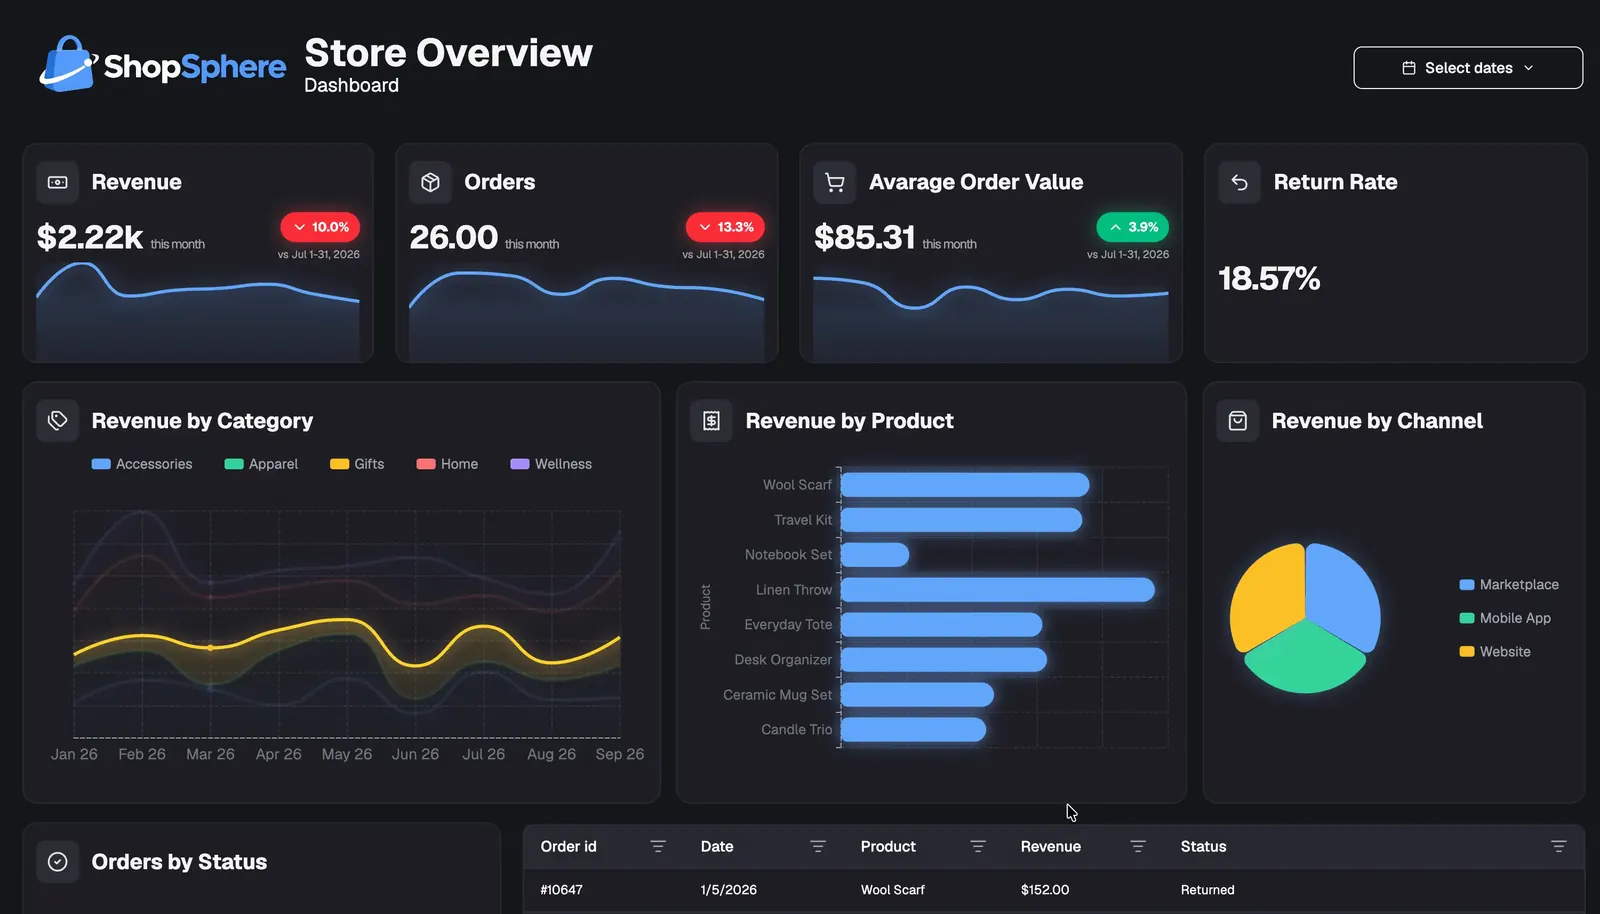
Public links
Share a dashboard with anyone using a URL.
Password protection
Require a password before opening a shared dashboard.
Private invitations
Give dashboard access to specific people by email.
Embeds
Embed a dashboard in another website or application with an iframe.
Businesses use Dashbreeze for
Team Productivity
Sales Pipeline Tracking
Marketing Campaign ROI
E-commerce Performance
Cash Flow Monitoring
Inventory Management
Agency Client Reporting
Project Tracking
Social Media Analytics
Ad Spend Tracking
Team Productivity
Sales Pipeline Tracking
Marketing Campaign ROI
Frequently asked questions
Everything you need to know about Dashbreeze.
Still have questions?