
Stripe
Connect Stripe billing and payment data to Dashbreeze dashboards.


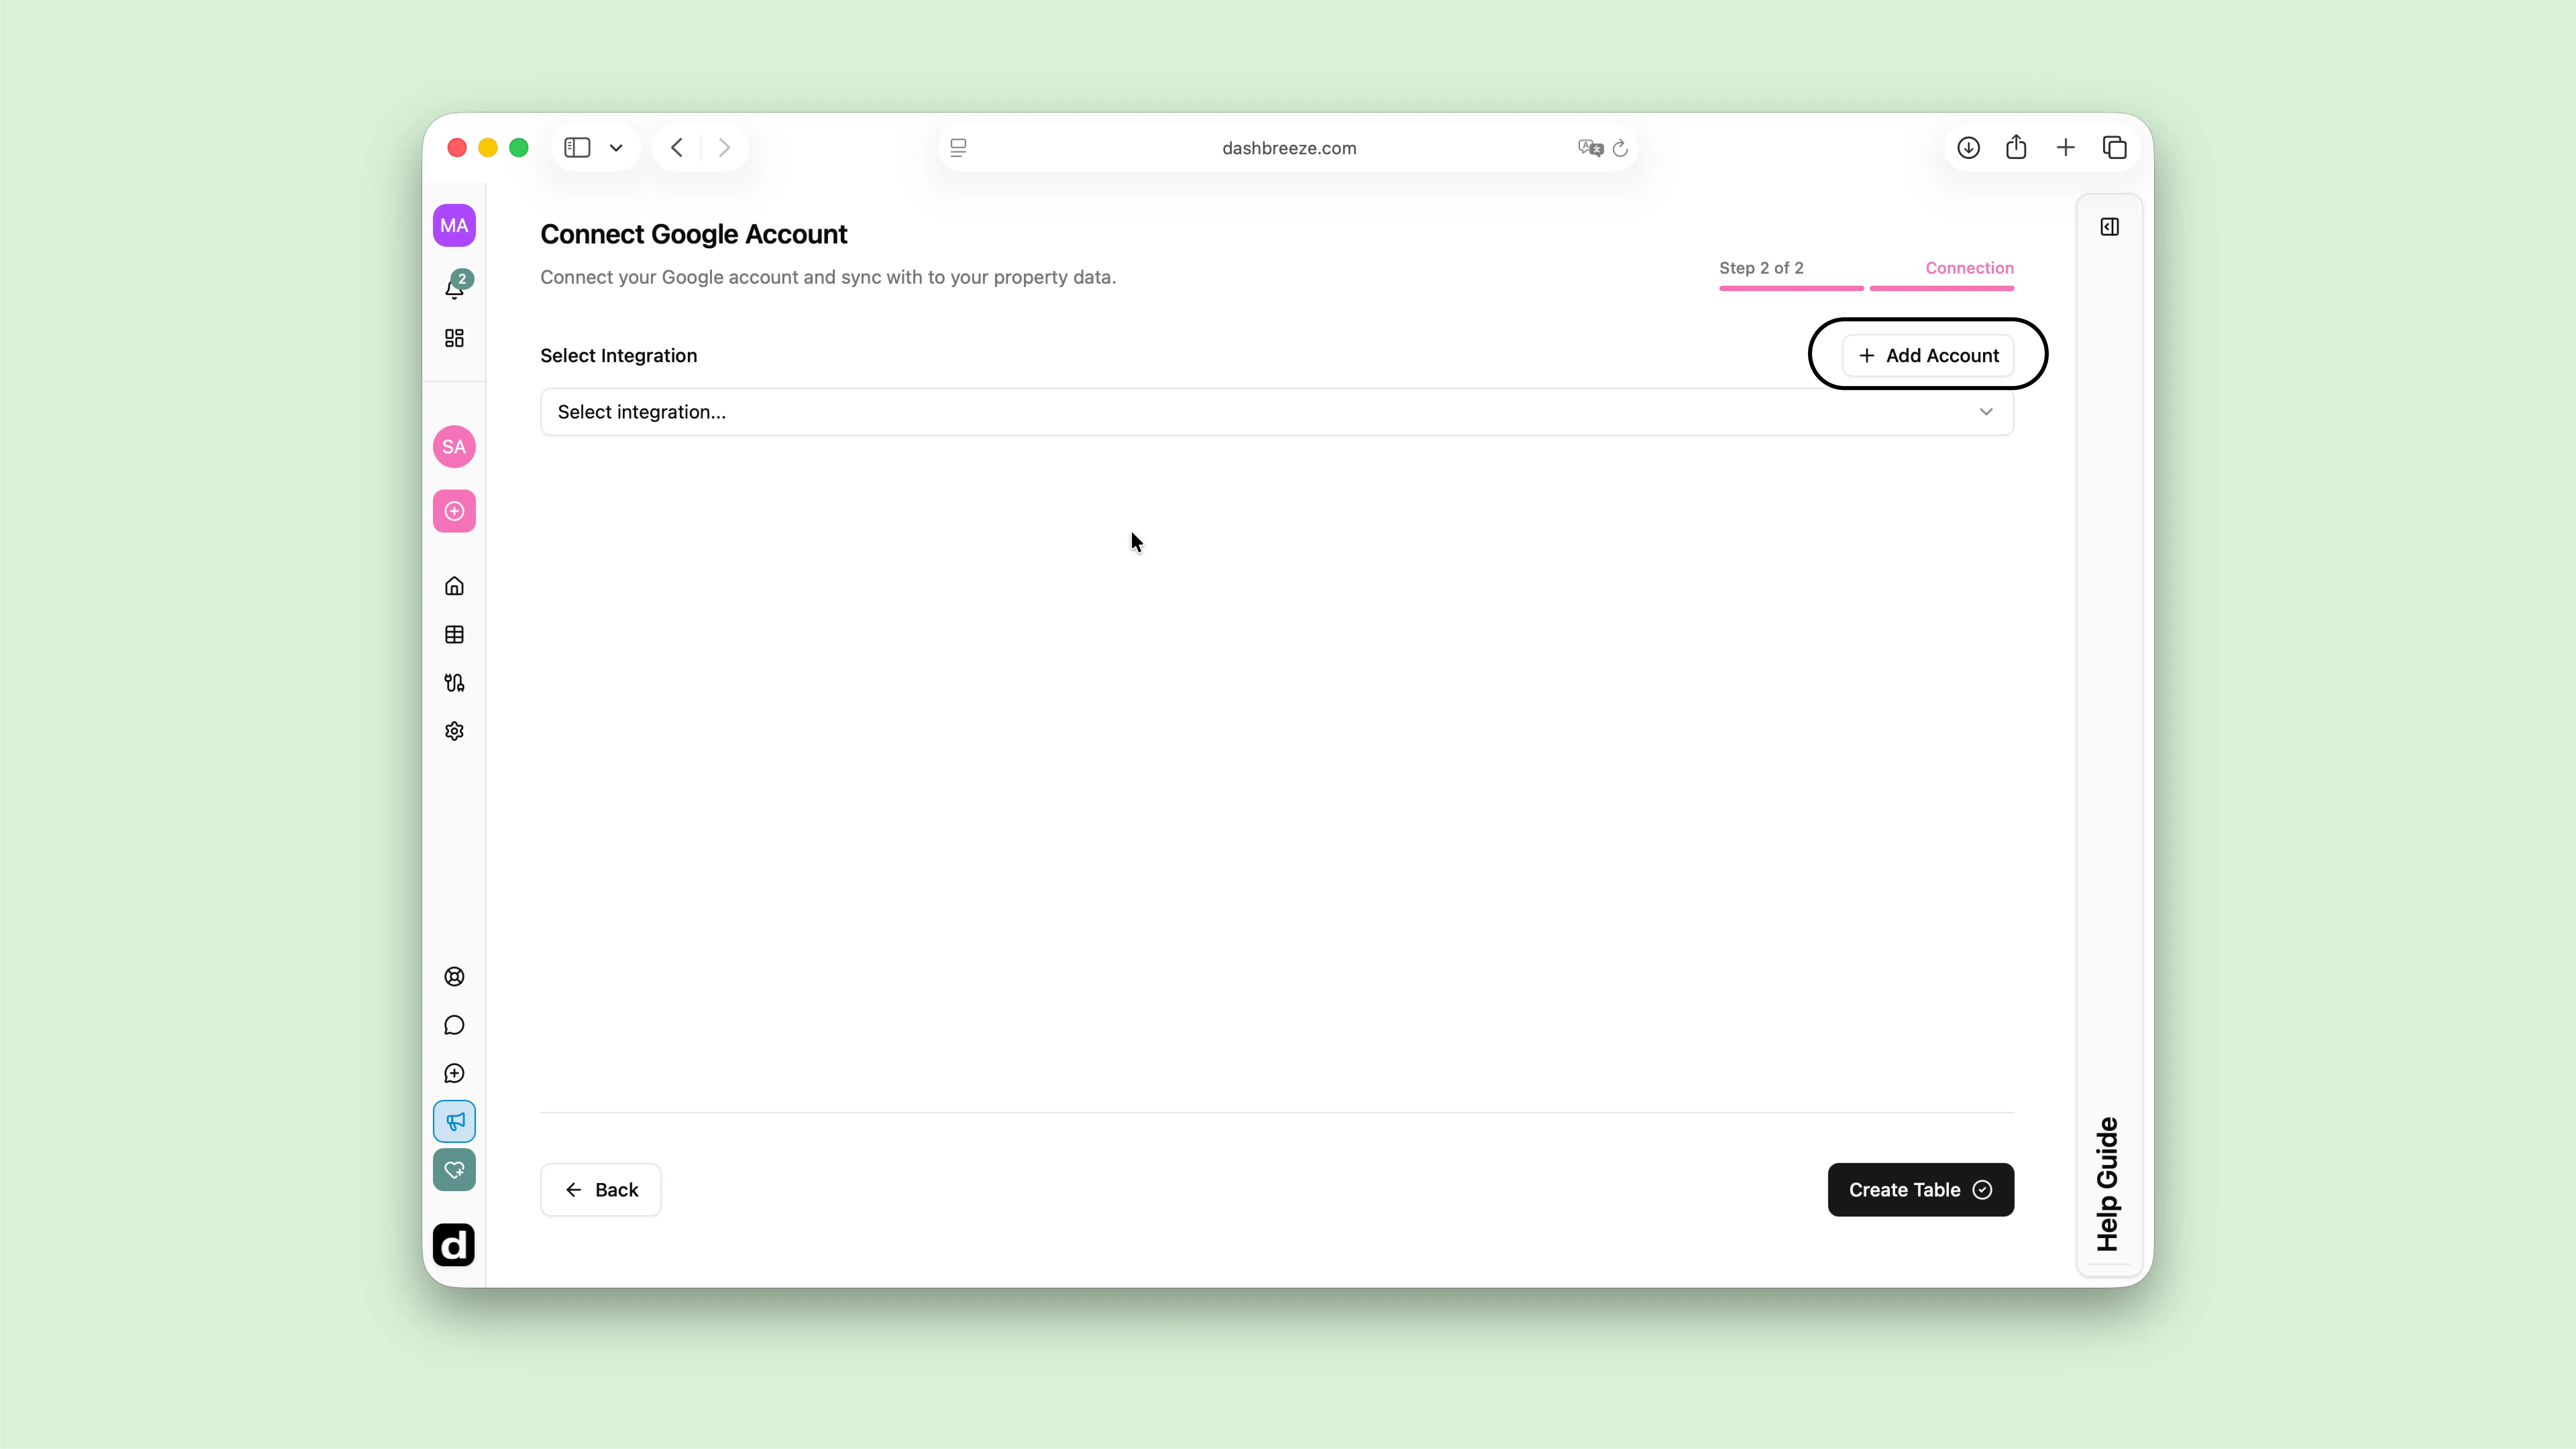
To connect Google Analytics to Dashbreeze, authorize a Google account, select a Google Analytics 4 (GA4) property, and choose the reports you want to import. Each report becomes a separate table for charts, metrics, and dashboards.
Important:Dashbreeze only reads report data from Google Analytics. It never changes your property settings, data streams, or configuration.
This creates an integration. You only do this once per Google account, and can reuse it for every GA4 property that account has access to.
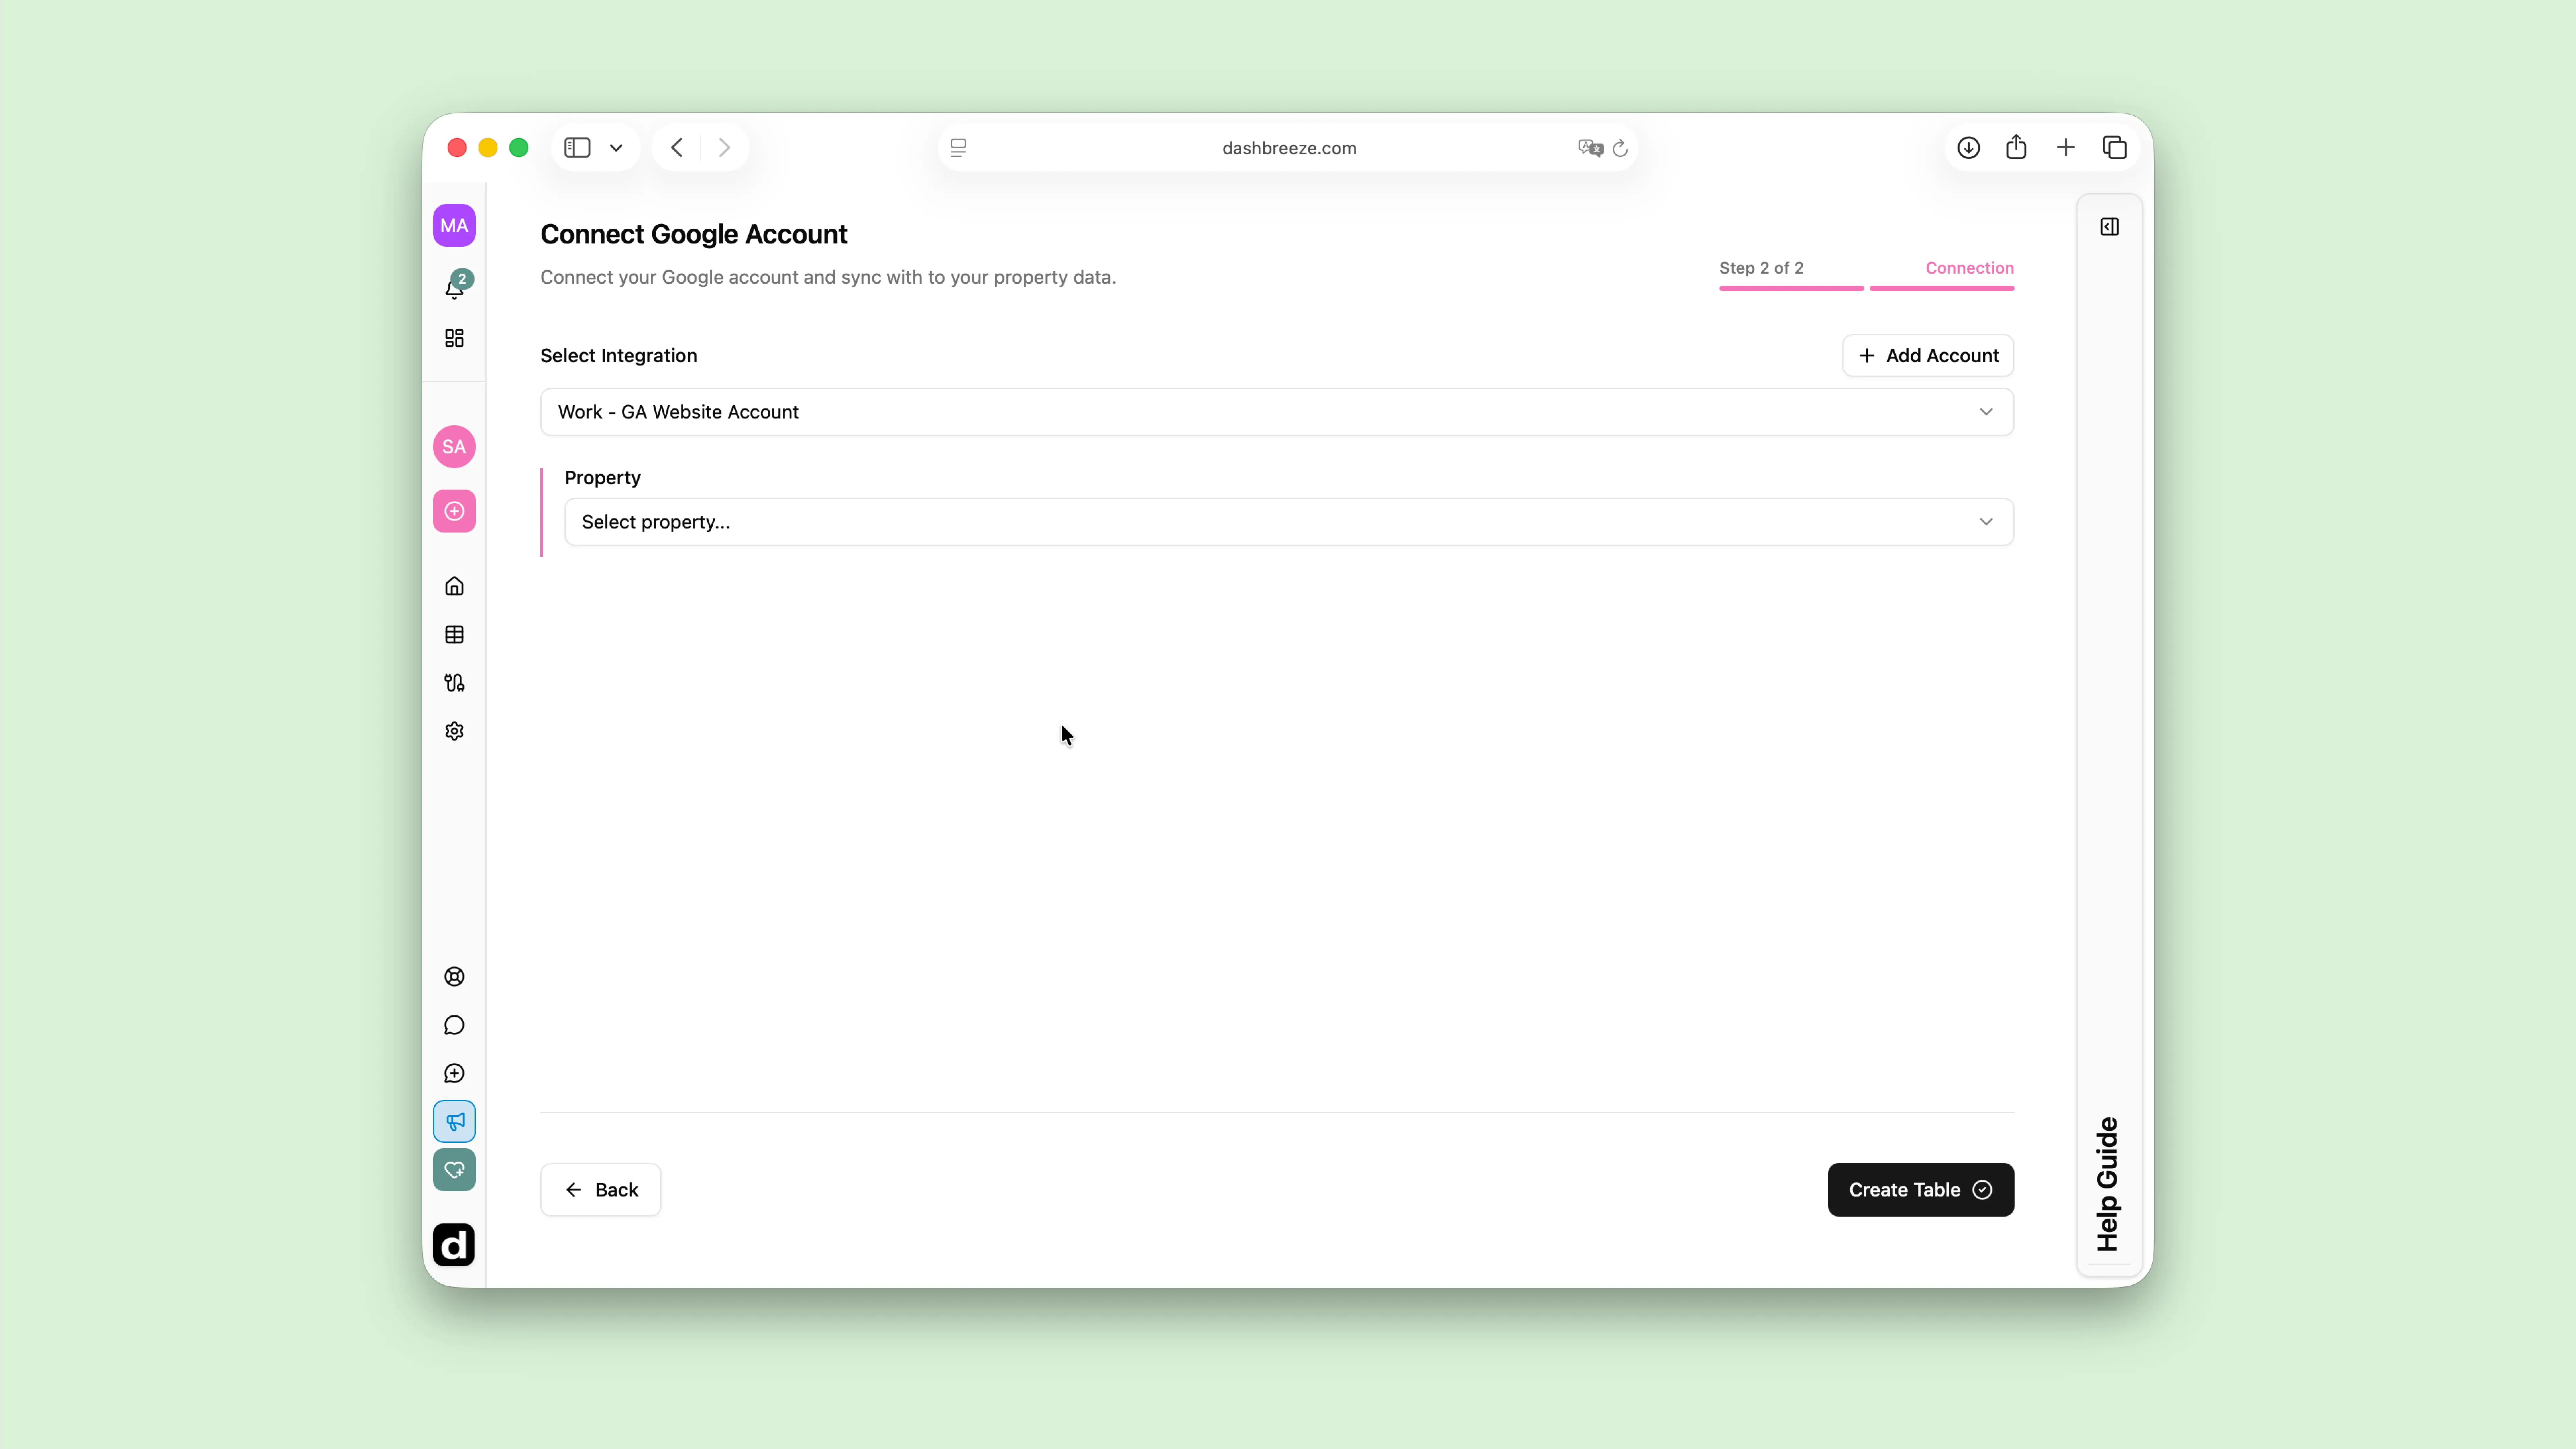
After connecting your Google account, choose the Google Analytics 4 property you want to import data from. The list includes every property the connected account has permission to access.
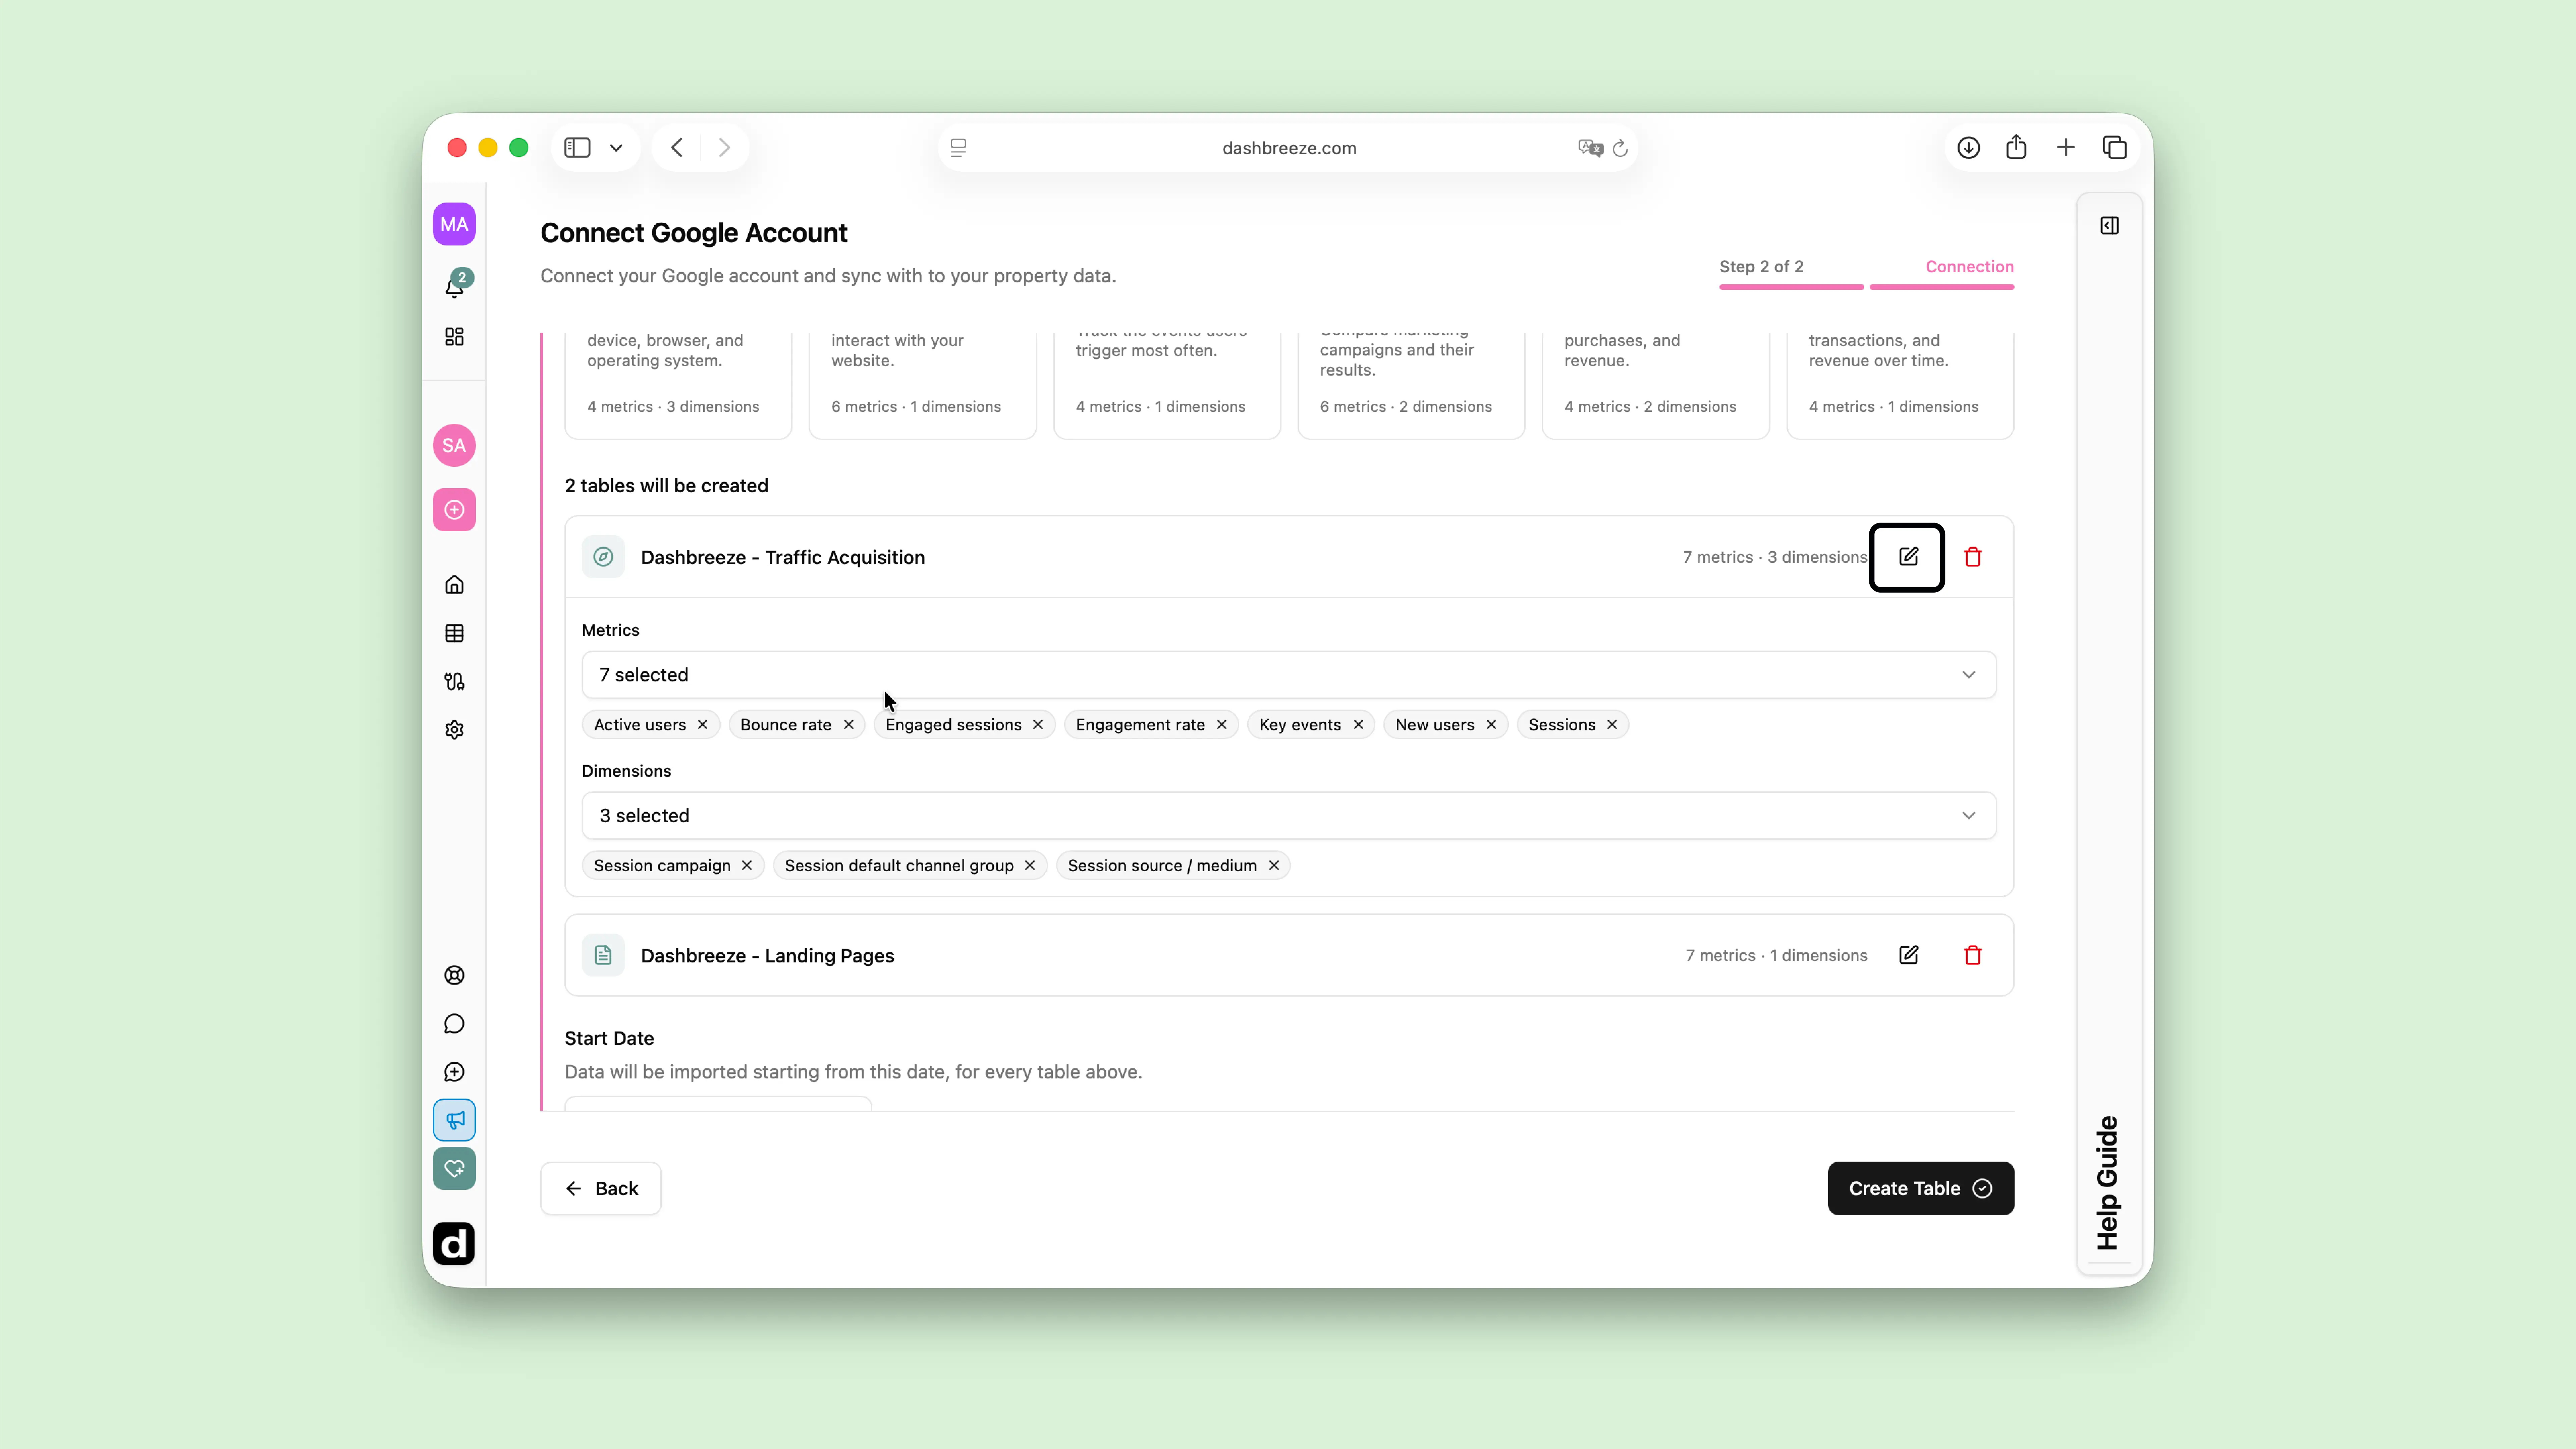
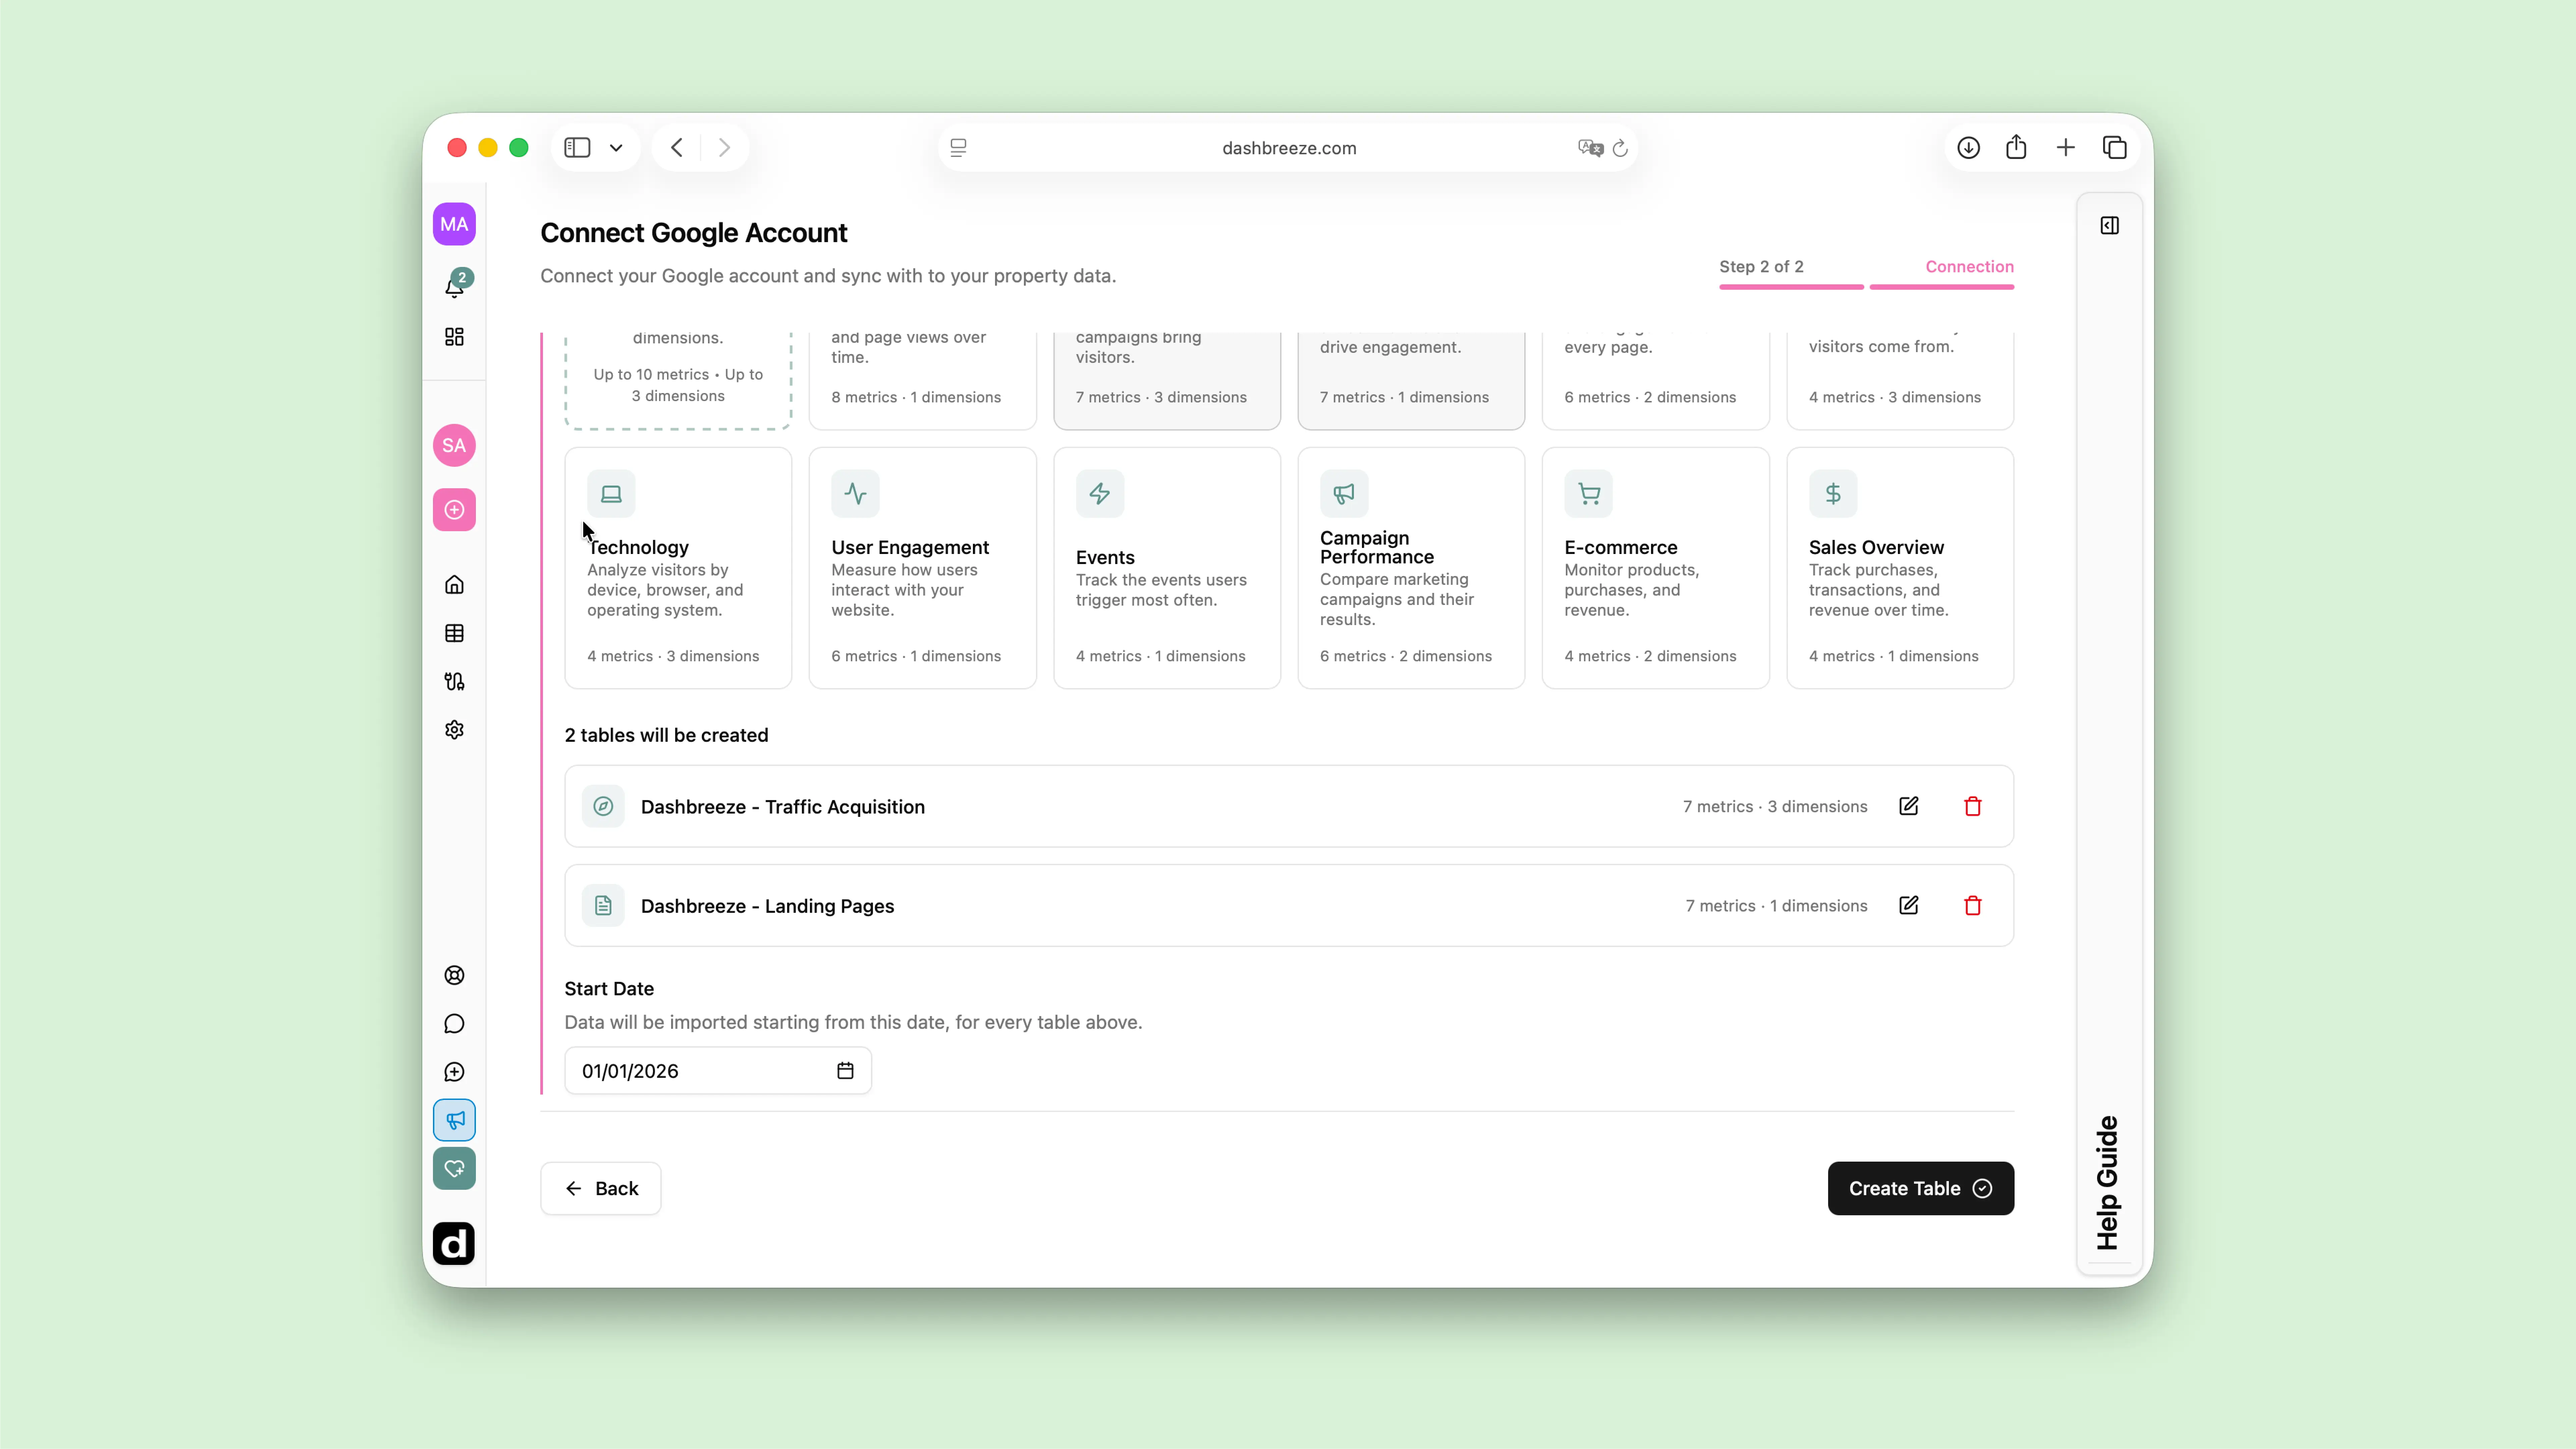
Dashbreeze provides report presets for traffic, acquisition, landing pages, page performance, geography, technology, engagement, events, campaigns, ecommerce, and sales. Select as many as you need; each preset becomes a separate table with relevant GA4 metrics and dimensions.
Presets are simply starting points. You can rename the table and add or remove metrics and dimensions before importing.
Traffic Overview
Track traffic trends, users, engagement, and page views over time.
Traffic Acquisition
See which channels, sources, and campaigns bring visitors.
Landing Pages
Discover which pages attract visitors and drive engagement.
Page Performance
Measure page views and engagement for every page.
Geography & Language
Understand where your visitors come from.
Technology
Analyze visitors by device, browser, and operating system.
User Engagement
Measure how users interact with your website.
Events
Track the events users trigger most often.
Campaign Performance
Compare marketing campaigns and their results.
E-commerce
Monitor products, purchases, and revenue.
Sales Overview
Track purchases, transactions, and revenue over time.
A metric is a numeric measurement, such as users, sessions, or revenue. A dimension describes that measurement, such as date, country, page, or traffic source.
To build a custom report, choose Start from Scratch instead, and pick up to 10 metrics and 3 dimensions yourself.
The Start Date controls how much historical GA4 data Dashbreeze requests. Every report table in the import includes data from that date onward.
By default, the Start Date is January 1 of the current year , but you can choose any earlier or later date.
Select enough history to show a meaningful comparison, but avoid requesting years of data when the dashboard only covers recent performance. All selected reports use the same starting point, so confirm that it suits both high-level metrics and time-series charts before starting the import.
Google Analytics is a live data source in Dashbreeze. Once connected, you do not need to reconnect the GA4 property when new analytics data becomes available.
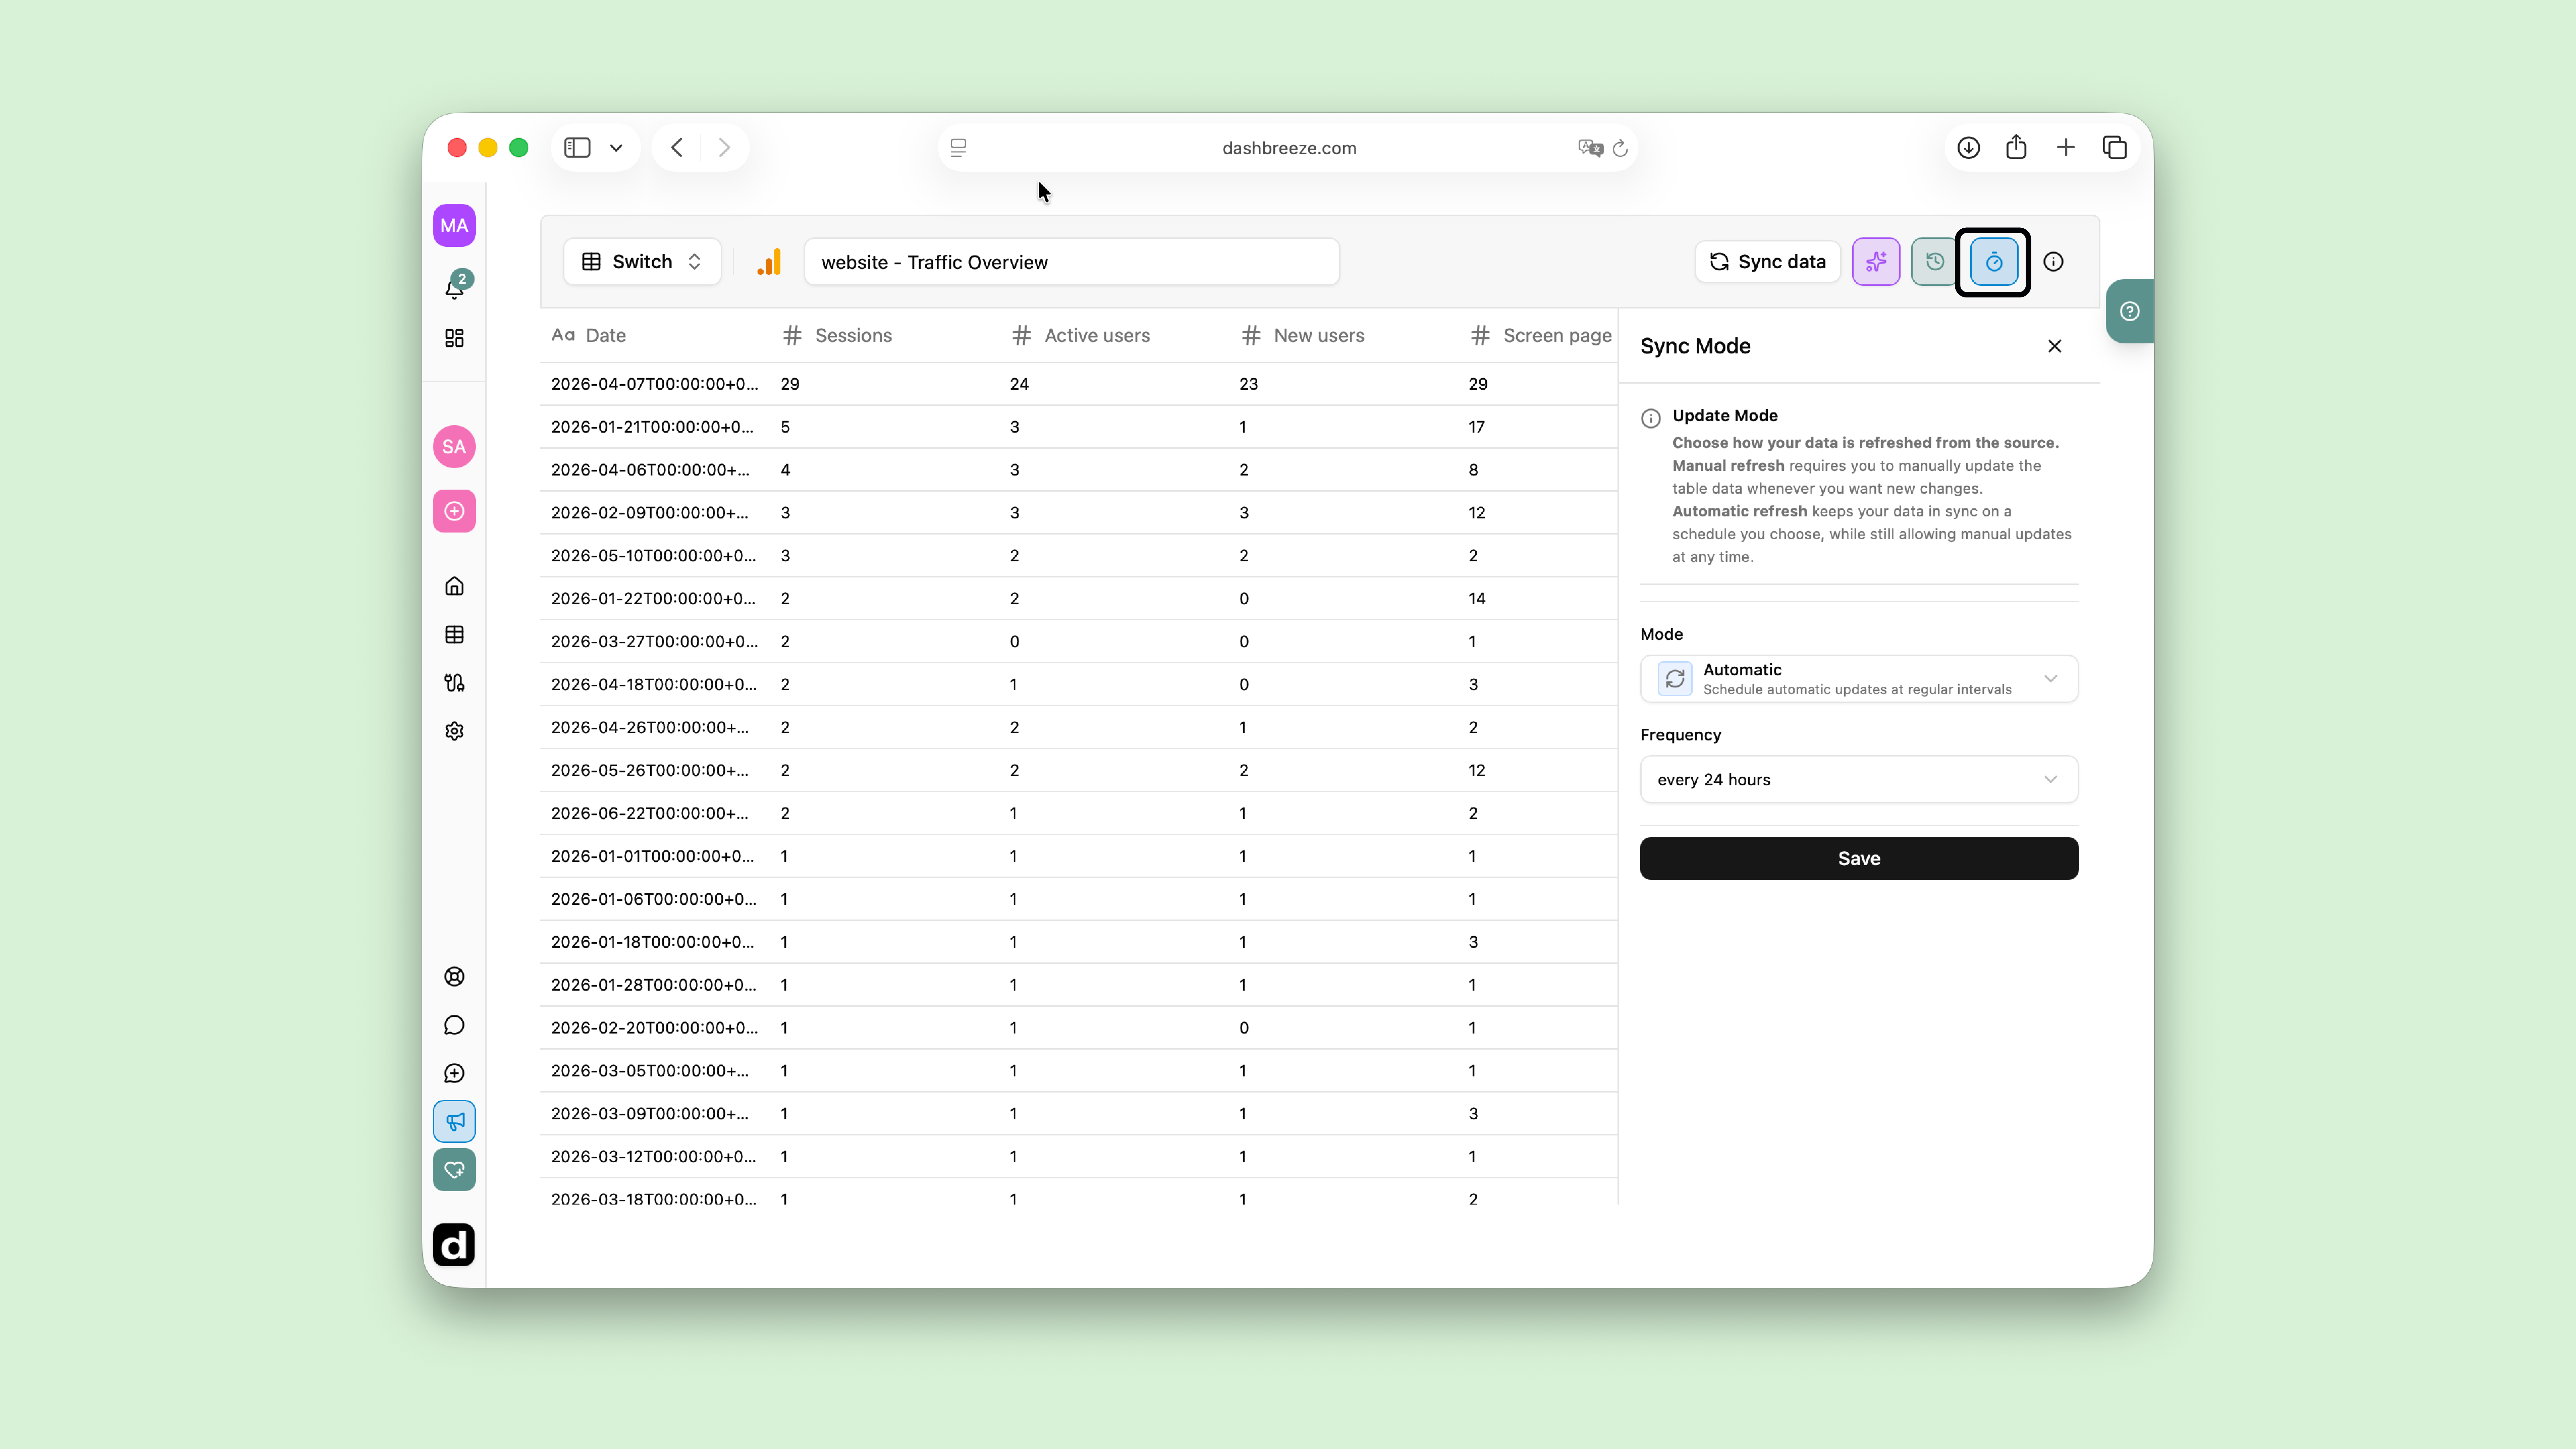
Open a table and choose how it should be updated. You can sync it manually whenever you want, or enable Automatic updates.
GA4 may continue processing recent activity after it first appears. A newly synced table can therefore differ from a report viewed later in Google Analytics. Also compare the same property, date range, metrics, dimensions, and filters before treating a difference as a connection problem.