Resources/Track SaaS revenue
Template guideHow to Track SaaS Revenue, MRR, and Conversions in Dashbreeze
This guide shows you how to use the Dashbreeze SaaS Analytics template. Connect your Stripe and Google Analytics accounts to follow recurring revenue, customers, churn, traffic, acquisition channels, and conversion rate in one view.
Track SaaS revenue and conversions, step by step
Open the SaaS Analytics template
Start in the Dashbreeze workspace where you want to create the dashboard.
What this step covers
- Sign in to Dashbreeze and open your organization workspace.
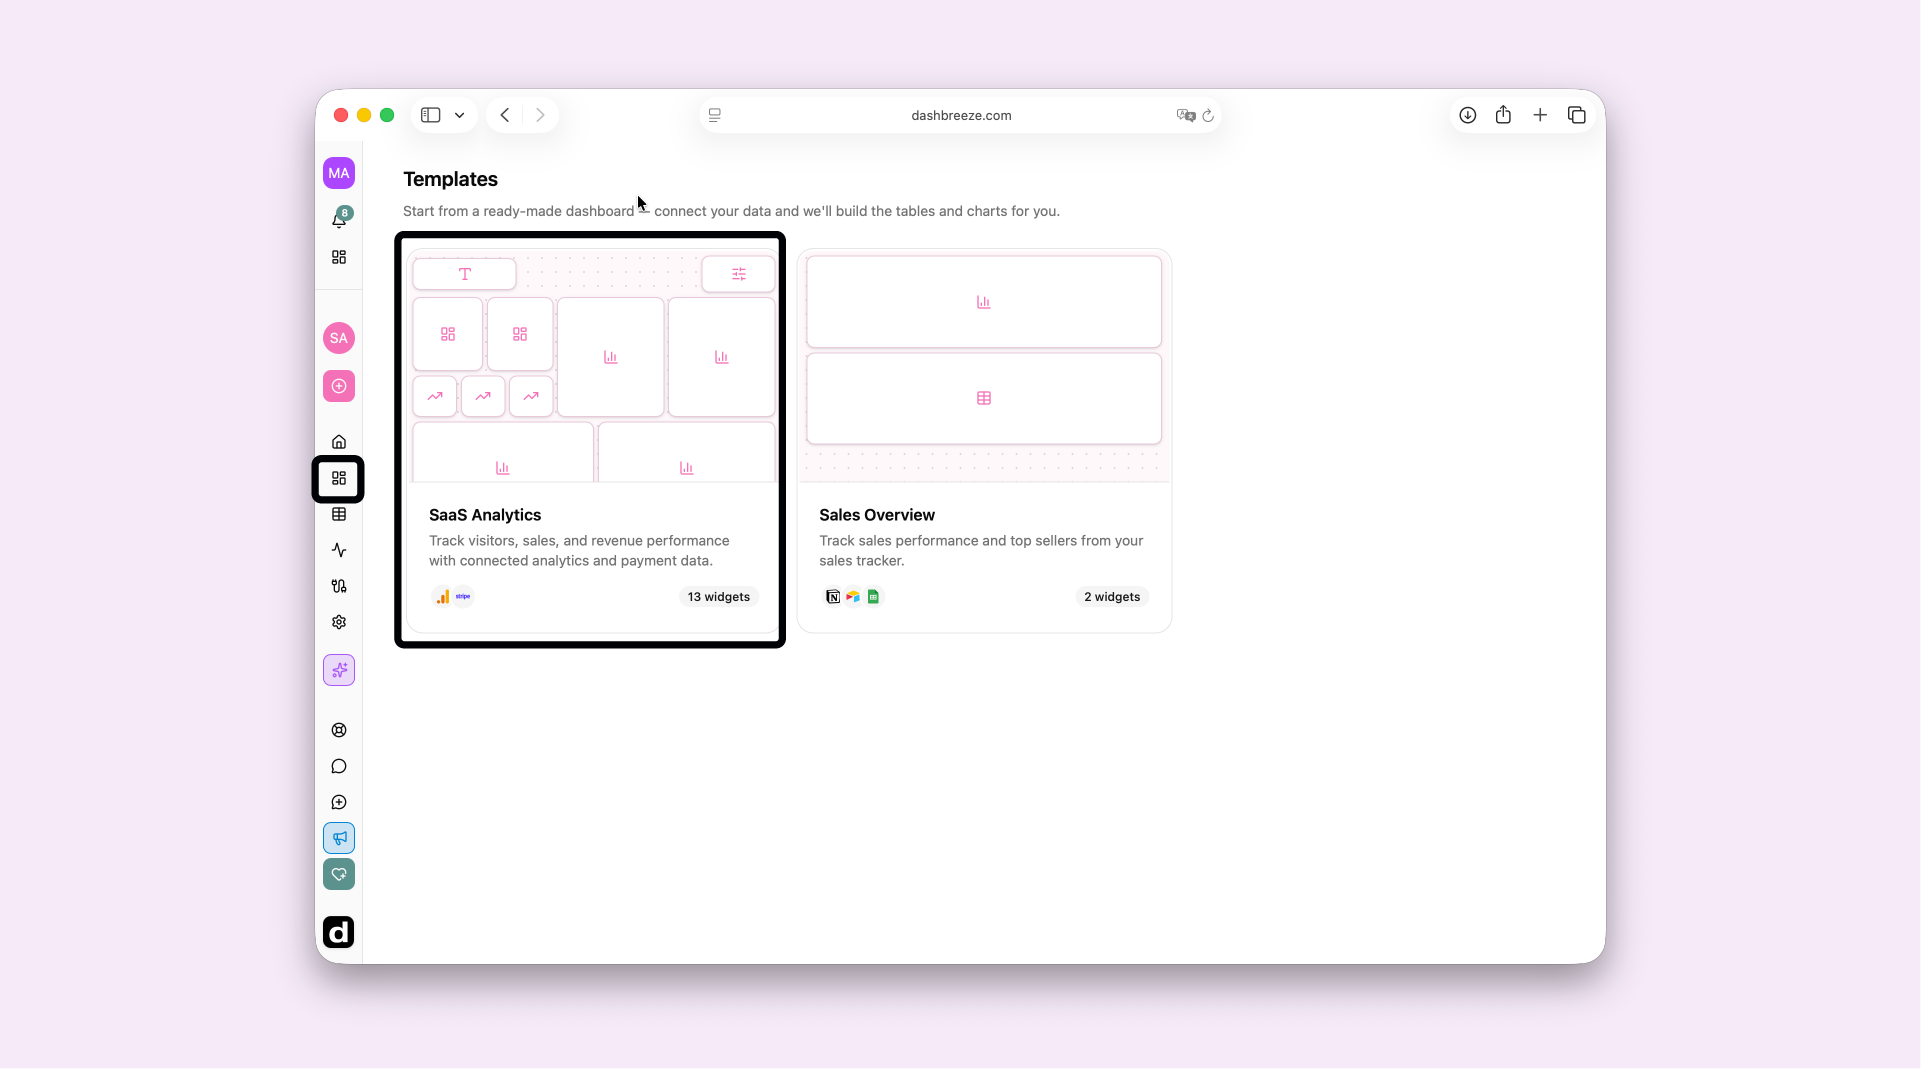
- Click Templates in the left sidebar.
- Find SaaS Analytics and click the template card.
Connect Google Analytics and Stripe
Connect the analytics and payment accounts that will provide the data for the dashboard.
What this step covers
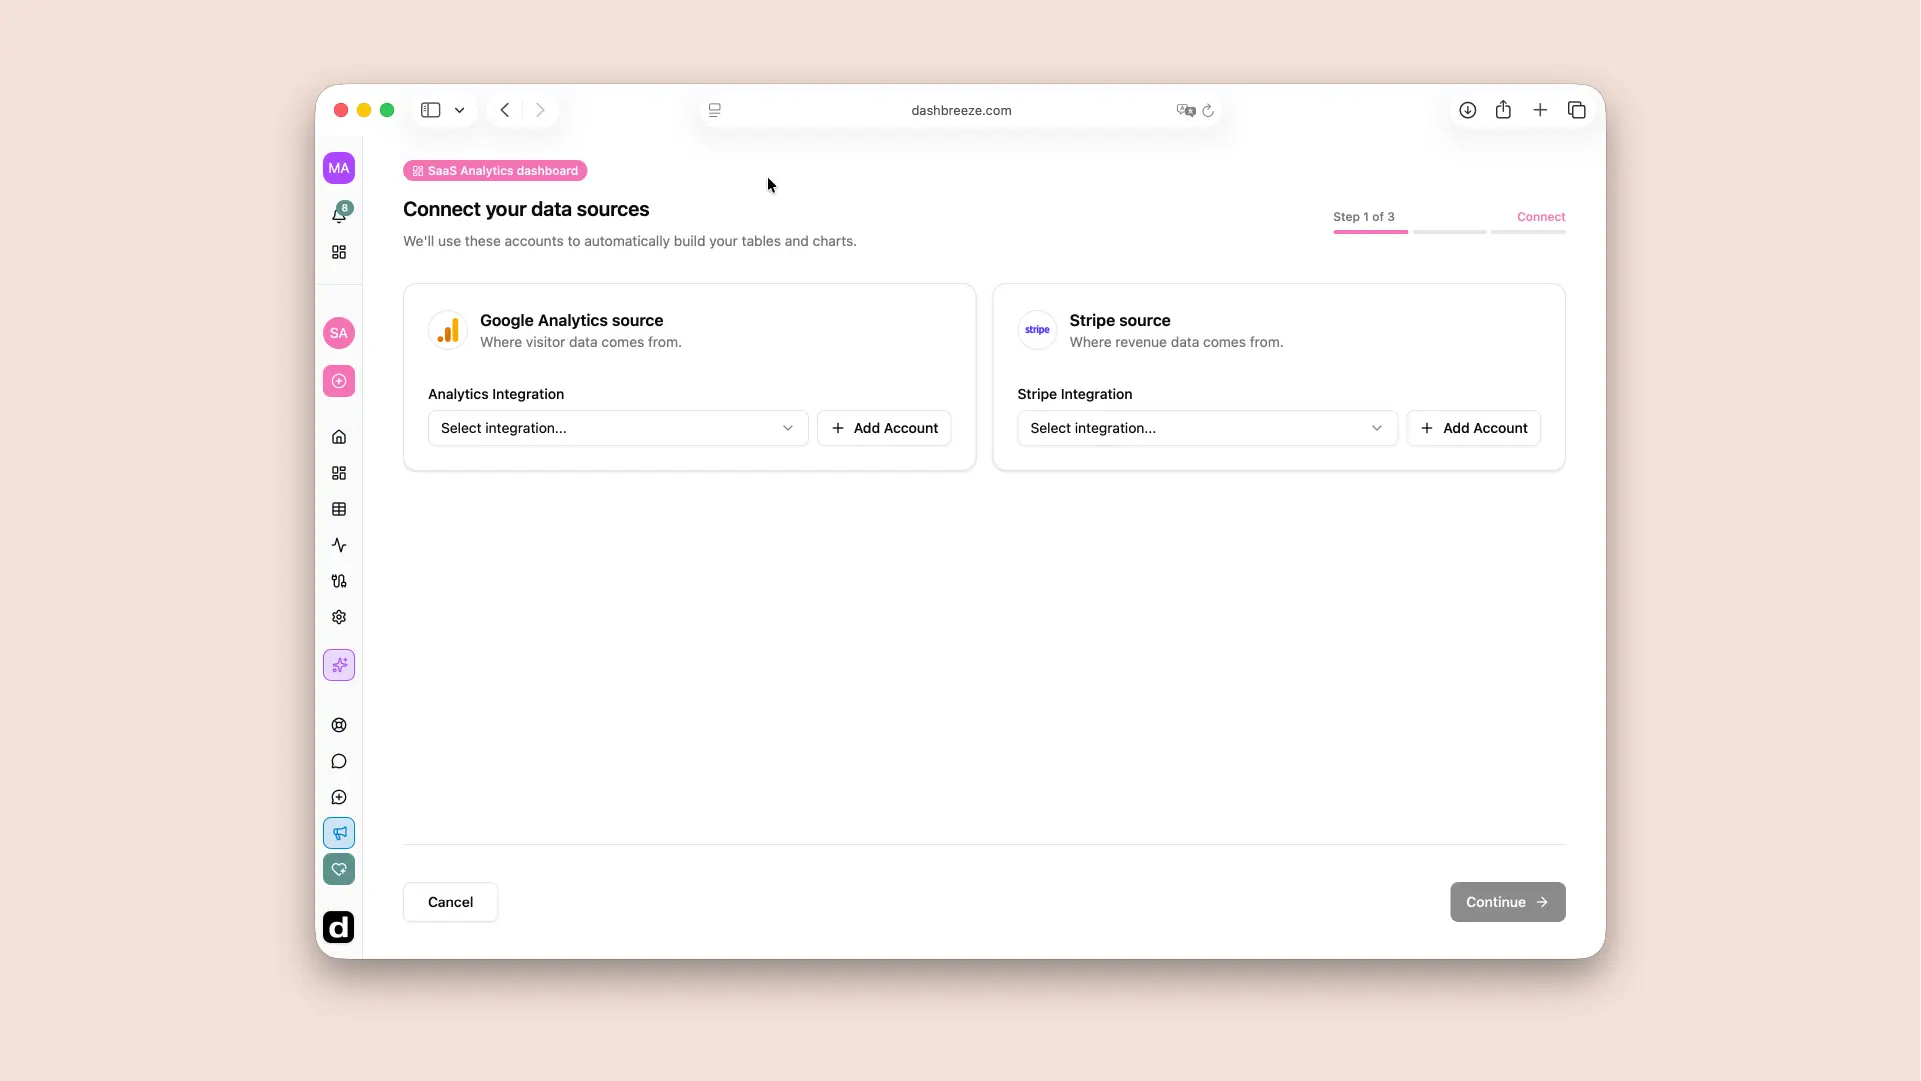
- Under Google Analytics source, select a connected account and the Google Analytics 4 property you want to report on. If needed, add a Google account with access to that property.
- Under Stripe source, select an existing Stripe connection. If needed, click Add Account and enter a Stripe restricted API key.
- When both connections are ready, click Continue.
Review the tables Dashbreeze will create
Dashbreeze prepares the data needed for the template and shows the tables before creating them.
What this step covers
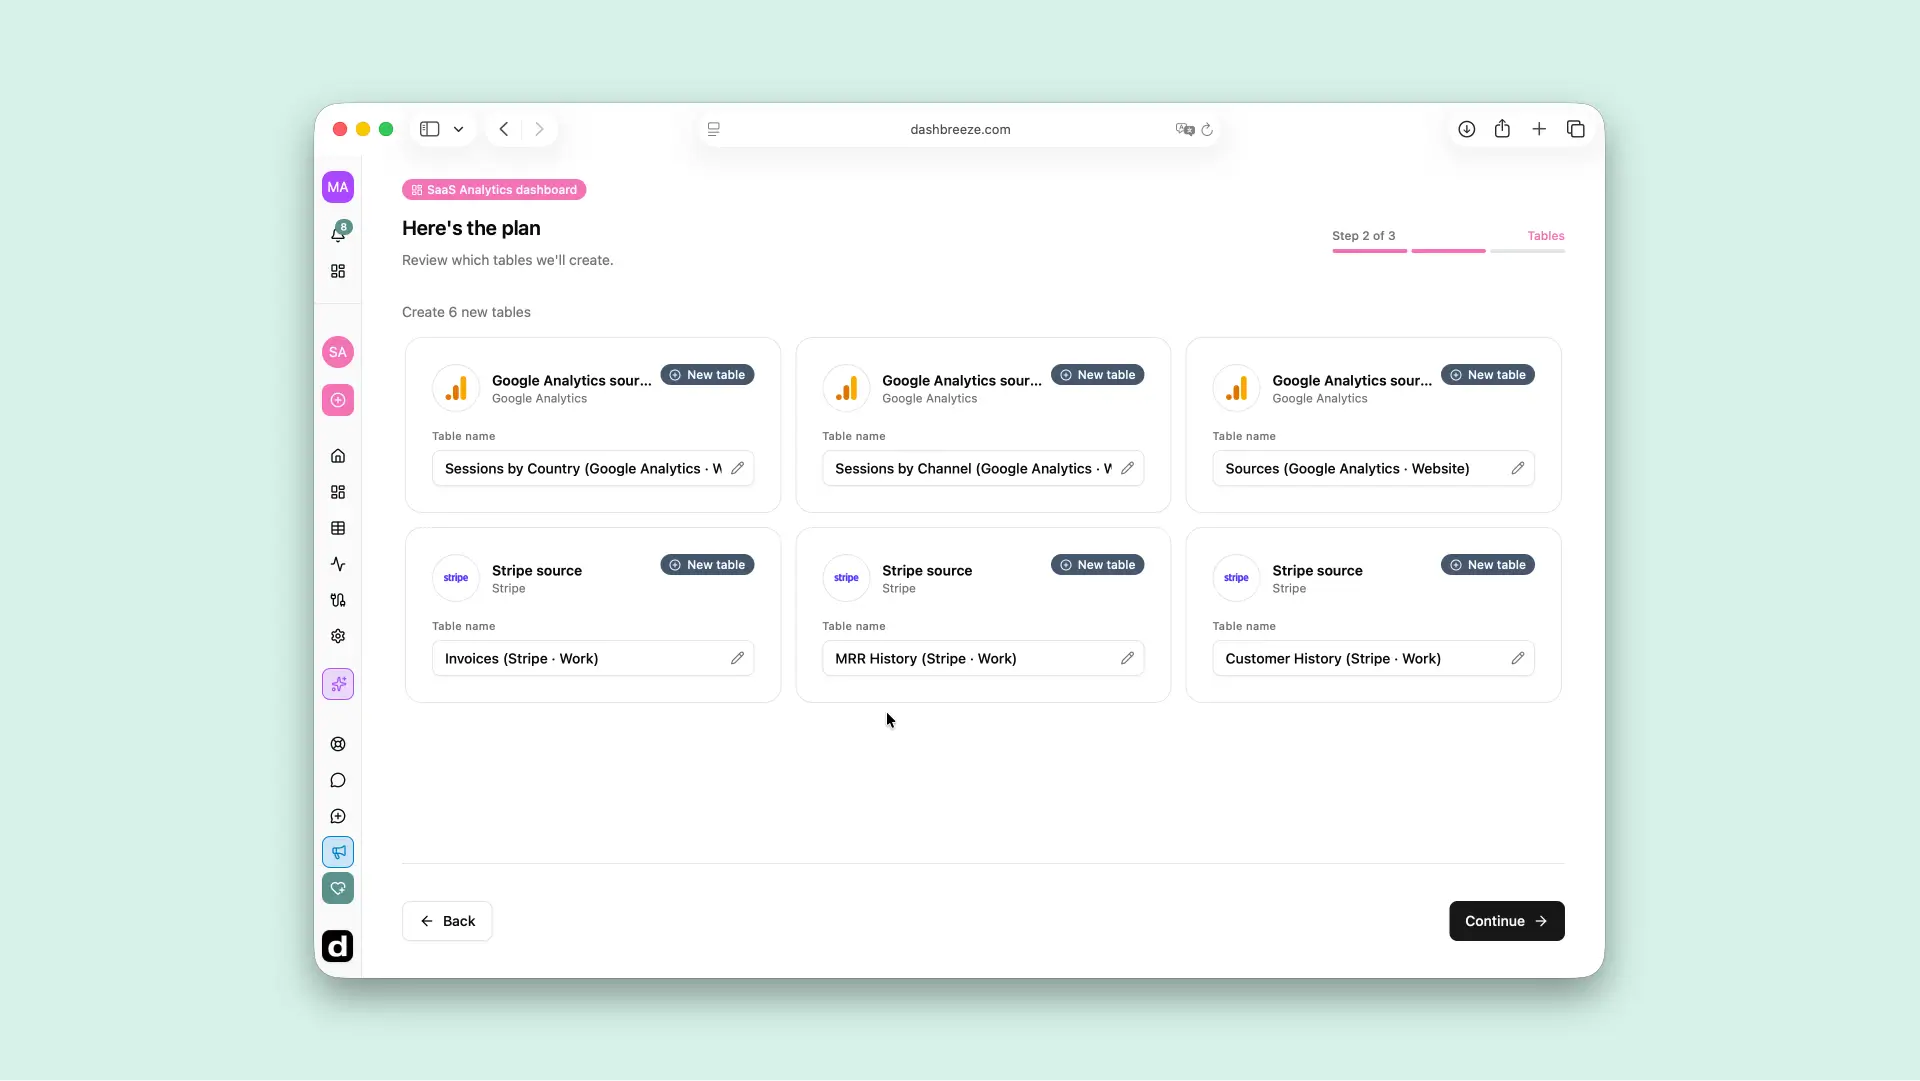
- Review the table names in the summary.
- Rename a table if you want it to be easier to recognize later.
- Click Continue when the list is ready.
From Google Analytics
- Sessions by Country shows where your visitors are located and how website activity and revenue vary by country.
- Sessions by Channel shows which acquisition channels bring visitors and generate revenue and key events.
- Sources shows which search engines, referring websites, or direct visits bring users and revenue to your business.
From Stripe
- Invoices shows how much invoice revenue your business collected over time.
- MRR History shows how monthly recurring revenue changes over time across customers and products.
- Customer History shows how your paying customer base changes as customers remain active or churn.
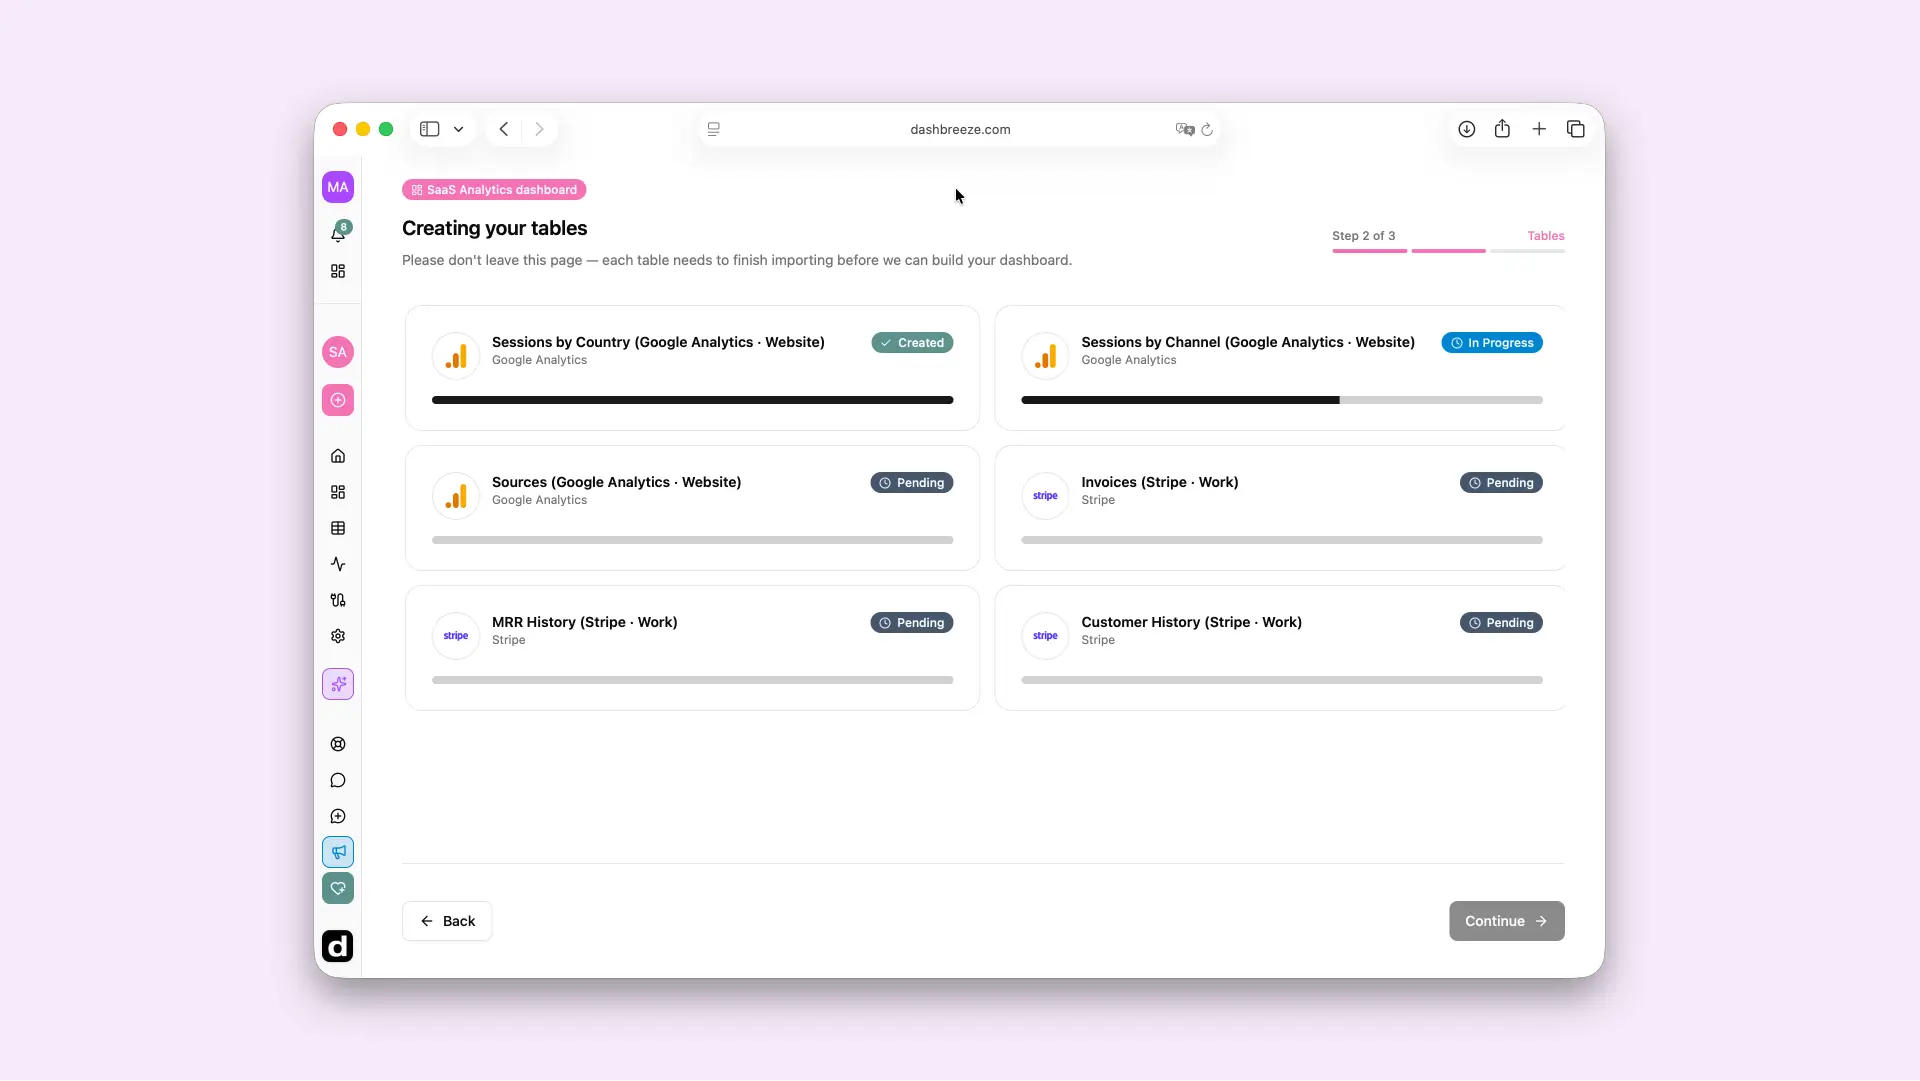
Wait for the data to finish importing
Dashbreeze now creates each table and imports the required data.
What this step covers
- Wait while the tables move from Pending to In Progress and then Created.
- If a table shows Error, click Try again.
- When the imports are finished, click Continue.
Choose how often the data should update
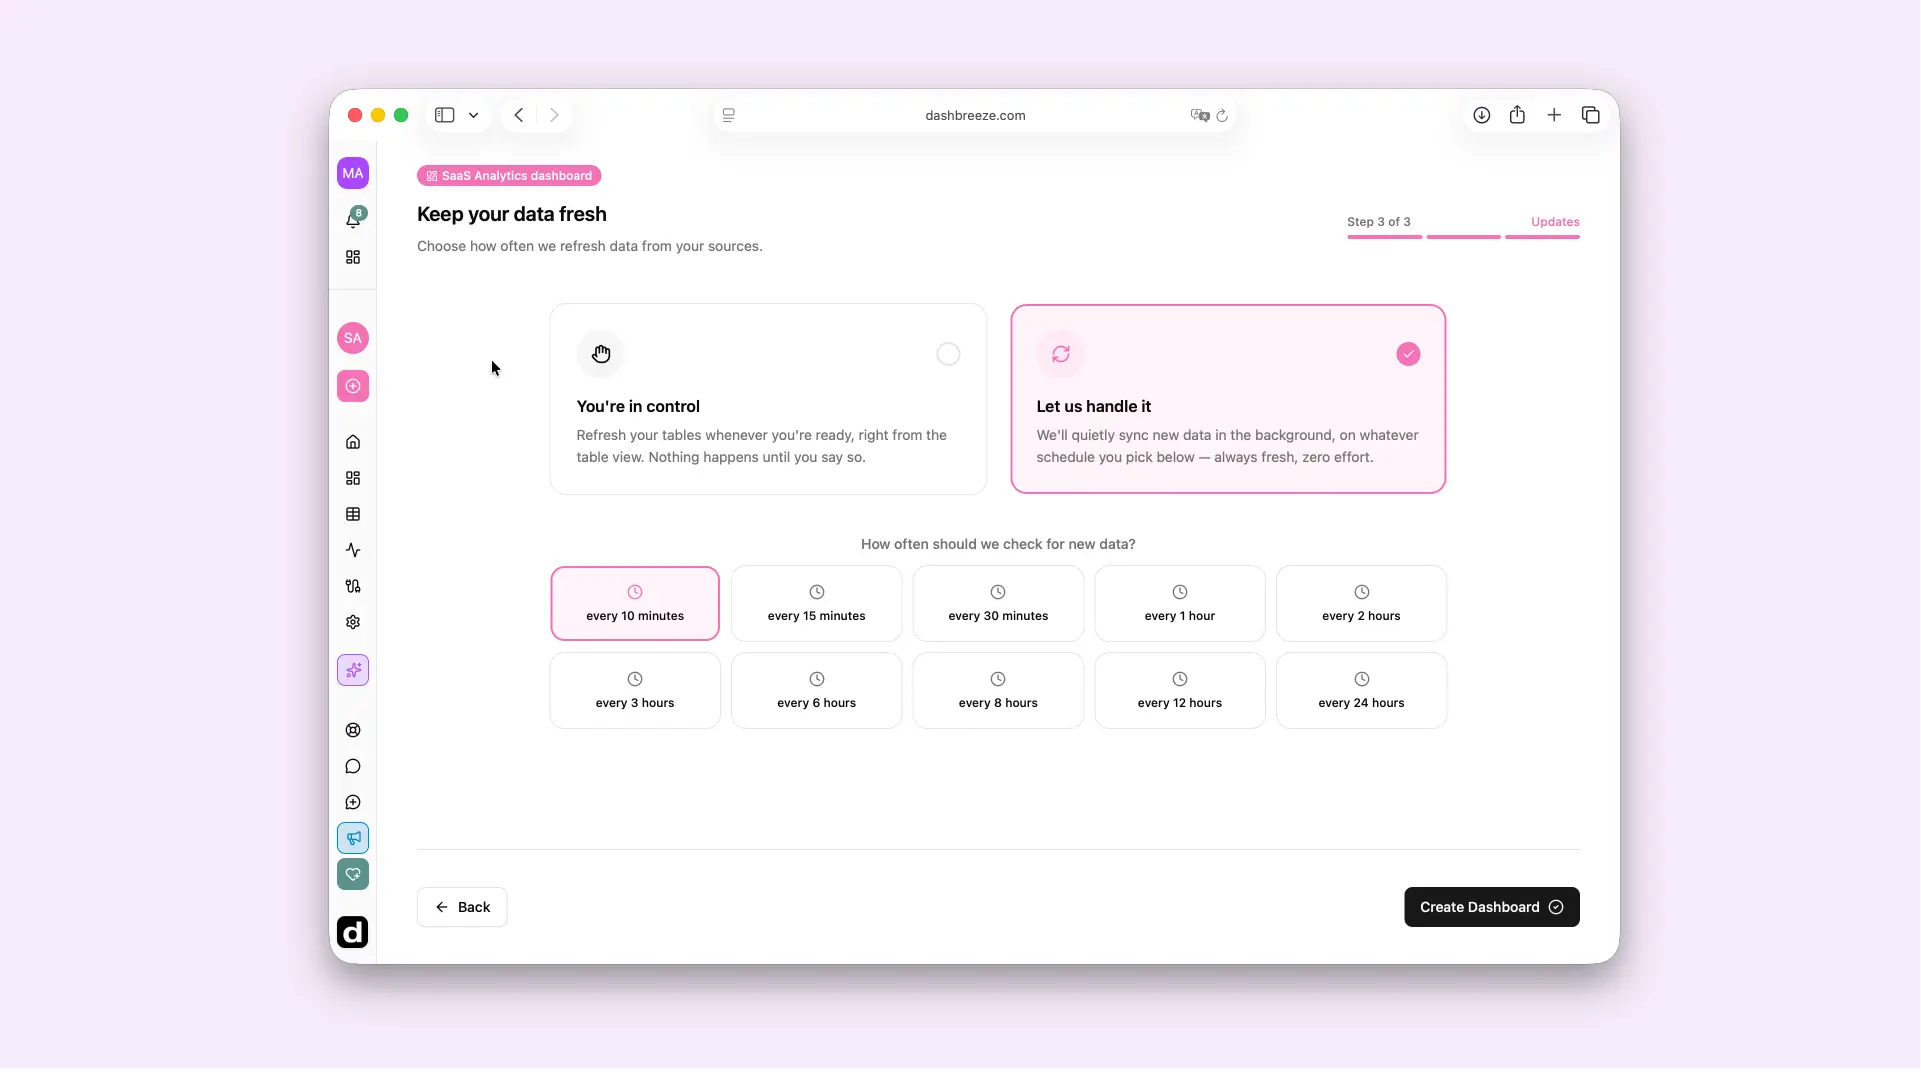
Choose whether you want to refresh the dashboard yourself or let Dashbreeze update its tables on a schedule.
What this step covers
- Choose Manual if you want updates to happen only when you request them.
- Choose an available automatic frequency if you want Dashbreeze to refresh the connected data periodically.
- Click Create Dashboard.
Explore the finished dashboard
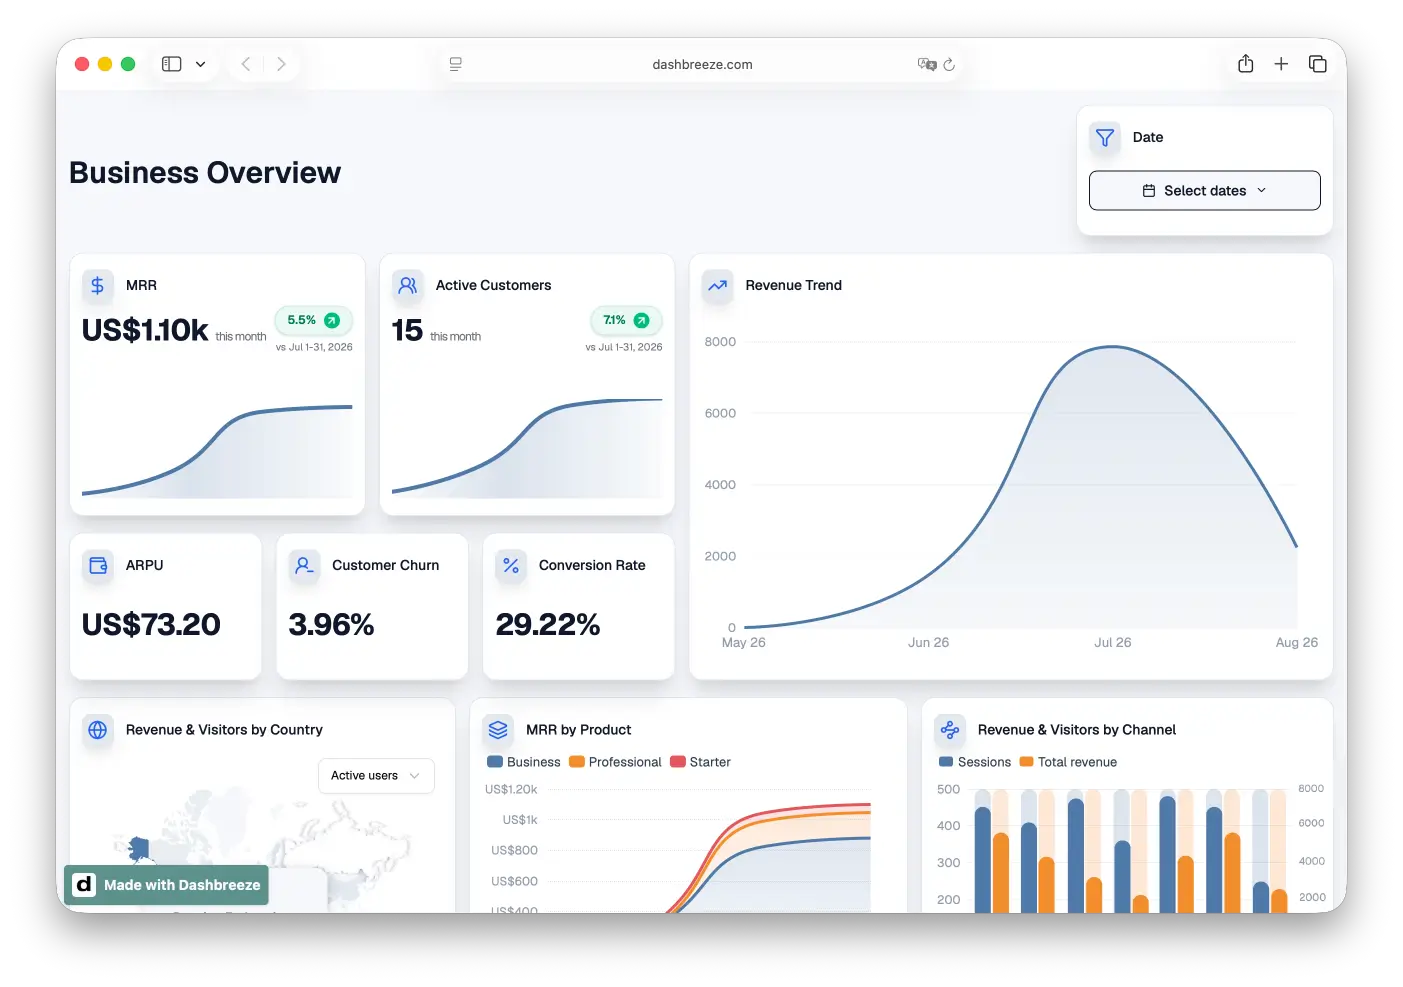
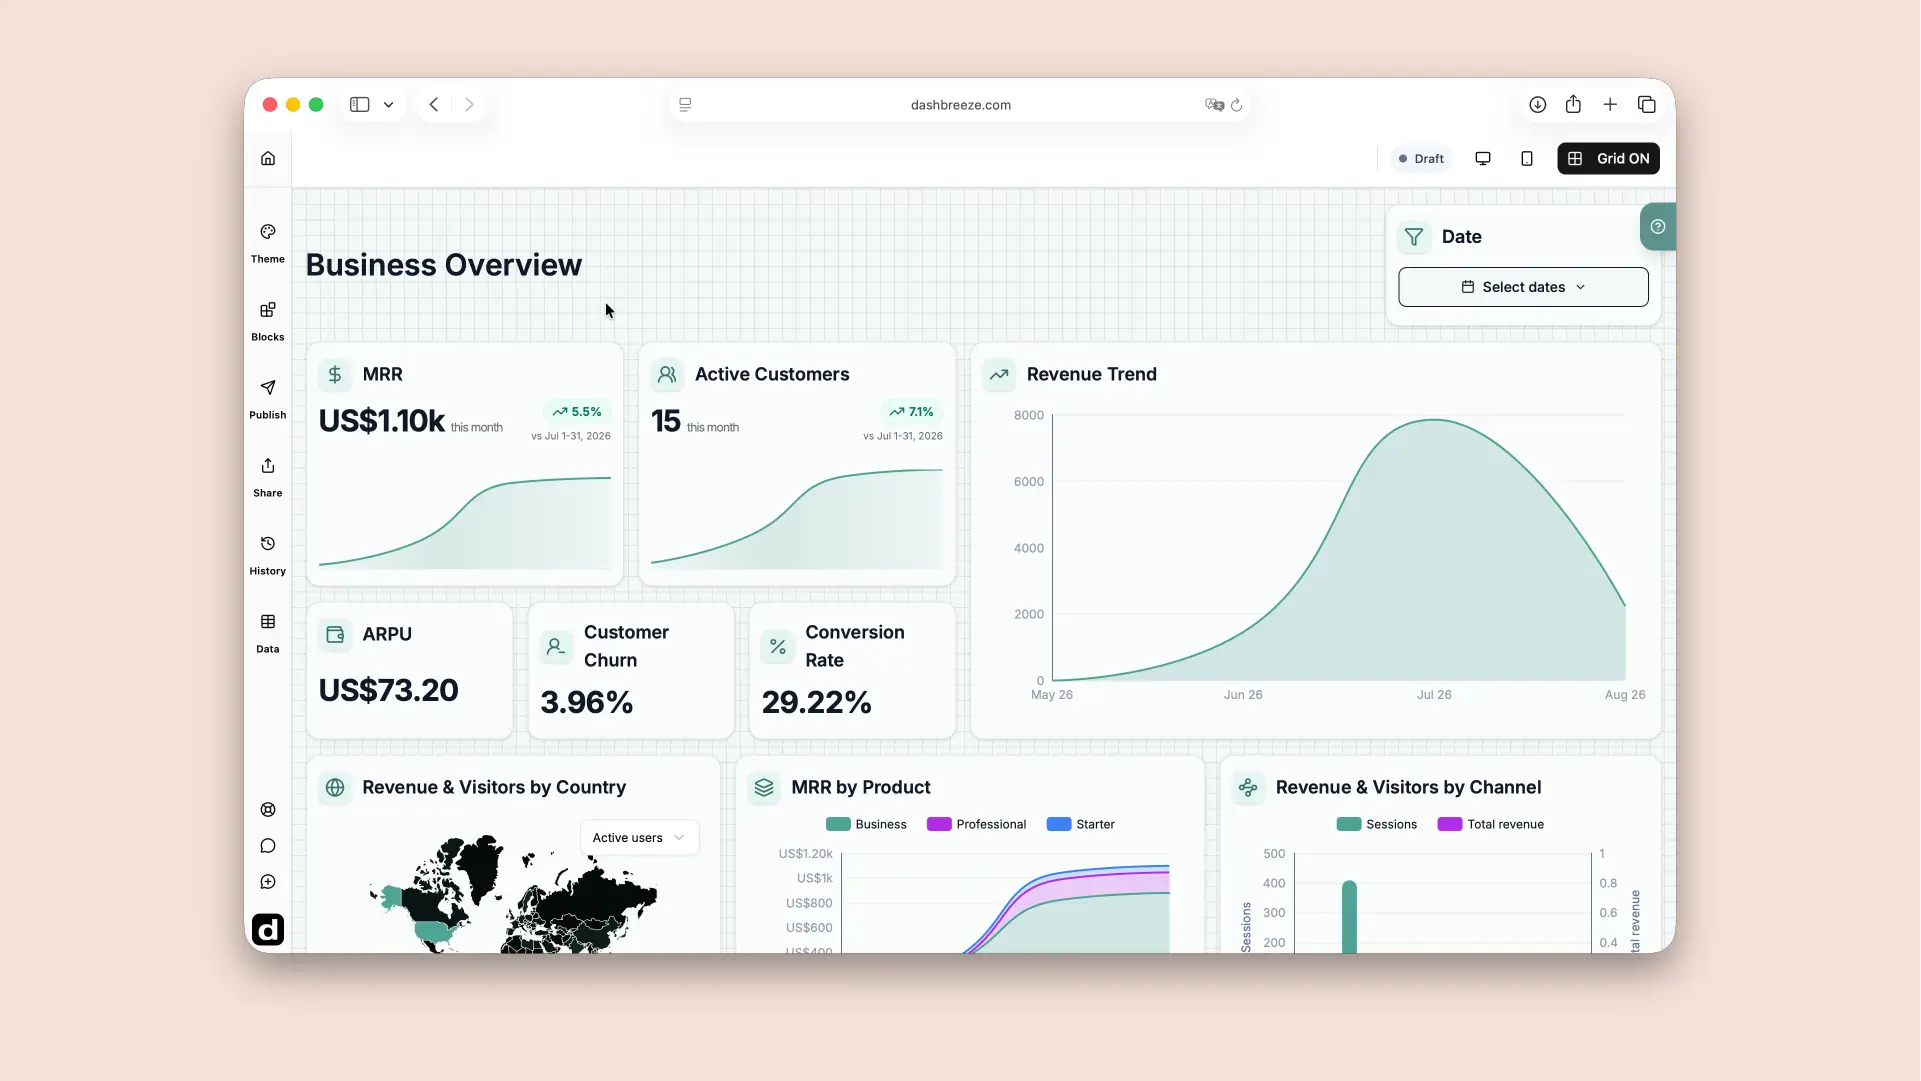
The template arranges Google Analytics and Stripe results in one ready-made business overview.
Website performance
- Visitors Trend shows sessions over time.
- Revenue & Visitors by Country maps active users, sessions, and Google Analytics revenue by country.
- Revenue & Visitors by Channel compares sessions and Google Analytics revenue by acquisition channel.
- Revenue & Active Customers by Source compares Google Analytics revenue and active users by traffic source.
- Conversion Rate compares Google Analytics key events with active users.
Revenue and customers
- Revenue Trend shows paid Stripe invoice revenue by month.
- MRR shows monthly recurring revenue in USD over time.
- Active Customers shows the number of paying customers over time.
- MRR by Product shows recurring revenue grouped by Stripe product.
- ARPU means average revenue per user. In this template, it shows current monthly recurring revenue divided by the number of current paying customers.
- Customer Churn shows the current-month customer churn rate.
Customize and share the dashboard
Use the generated dashboard as a starting point and adjust it for your team, company, or clients.
What this step covers
- Change the theme, titles, colors, or block styles in the dashboard editor.
- Move or resize blocks to change the layout.
- Test the dashboard before publishing. Open Publish in the left sidebar and click Preview Dashboard. The preview opens in a new tab and shows how the dashboard will look to viewers.
- Publish the dashboard when it is ready, then choose how you want to share it.
Recap: from two sources to one view
Dashbreeze guides you from two connected accounts to a finished dashboard. Select the sources, review the tables, wait for the data, and choose how often it should update.
- 1. Open your Dashbreeze workspace, click Templates in the left sidebar, and select SaaS Analytics.
- 2. Select the required Google Analytics integration and GA4 property.
- 3. Select the required Stripe integration for the payment source.
- 4. Review the three Google Analytics tables and three Stripe tables in the plan.
- 5. Create the tables and retry any failed import tasks.
- 6. Choose manual or periodic updates, then create the dashboard.
Need help with a connection?
Find detailed product instructions in the Help Center
This guide covers the complete template workflow. Use these articles for more detail about a connection or dashboard step.
Quick answers
- What do I need before using the template?
- You need a Google account with access to the GA4 property you want to use and a Stripe connection for the billing data you want to report on.
- What does Dashbreeze create for me?
- Dashbreeze creates six connected tables and a ready-made dashboard with a Date filter, website-performance charts, Stripe revenue charts, and customer KPIs.
- What does the Conversion Rate show?
- A key event is an event you mark as important in Google Analytics 4, such as a completed purchase, subscription, or sign-up. The template divides the number of key events by active users. To use it as a customer-conversion metric, make sure the relevant event is marked as a key event in your GA4 property.
- What does ARPU mean?
- ARPU means average revenue per user. In this template, Dashbreeze calculates it by dividing current monthly recurring revenue in USD by the number of current paying customers.
- Does the dashboard combine Stripe customers with GA4 sources?
- No. The source and channel charts use revenue and user data reported by Google Analytics. Stripe powers the invoice, MRR, product, active-customer, ARPU, and churn blocks.
- What does MRR by Product include?
- It shows recurring subscription revenue in USD grouped by Stripe product. It does not include one-time charges.
- Can I customize the template?
- Yes. After Dashbreeze creates the dashboard, you can change its theme, layout, titles, colors, blocks, and sharing settings in the editor.
- Will the dashboard update automatically?
- You can choose Manual updates or an automatic update frequency available with your Dashbreeze plan.