

Sorting & Filtering Data
Put rows in a useful order and show only the data that matches your conditions.

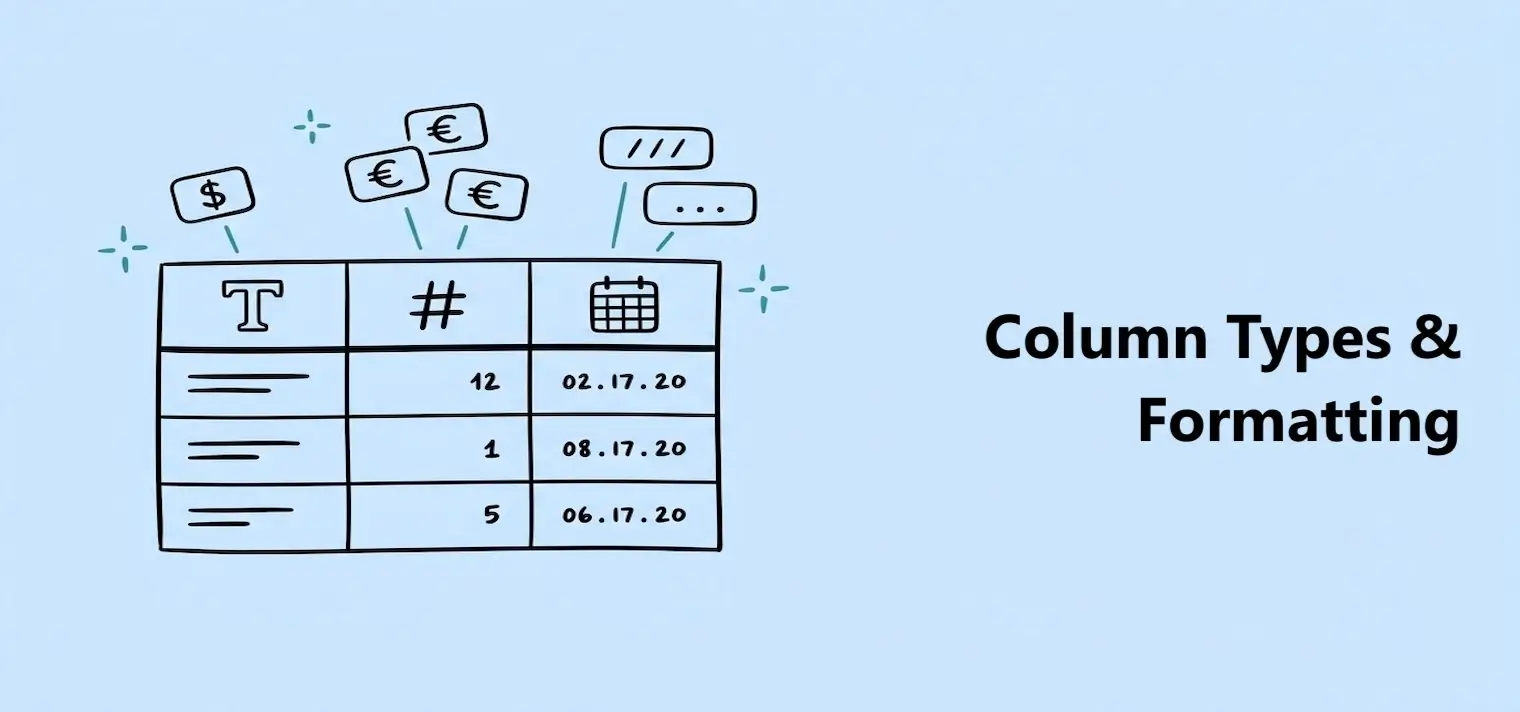
Every column has a type and may also have a format. Together, they tell Dashbreeze how to understand the column and how to display its values.
Column type
Defines what the value means
Determines which sorting, filtering, grouping, and calculations are available. The options are Text, Number, and Date.
Column format
Defines how the value looks
Shows the same number as a currency or percentage, or the same date in a different pattern, without changing its meaning.
Text
Words, names, IDs, labels, and categories—even when they contain digits.
Examples: Customer name, Product ID, Region
Number
Values you want to calculate, compare, sum, average, or show as currency and percentages.
Examples: Revenue, Quantity, Conversion rate
Date
Calendar dates and timestamps that can be sorted chronologically or filtered by a period.
Examples: Order date, Created at, Renewal date
IDs usually belong in Text columns:A value such as 001204 may contain only digits, but it identifies something rather than measuring it. Keeping it as Text preserves leading zeros and prevents it from being summed or averaged.
Dashbreeze detects a type when the table is imported. If that type is not useful for your analysis, change it in the transformation editor.
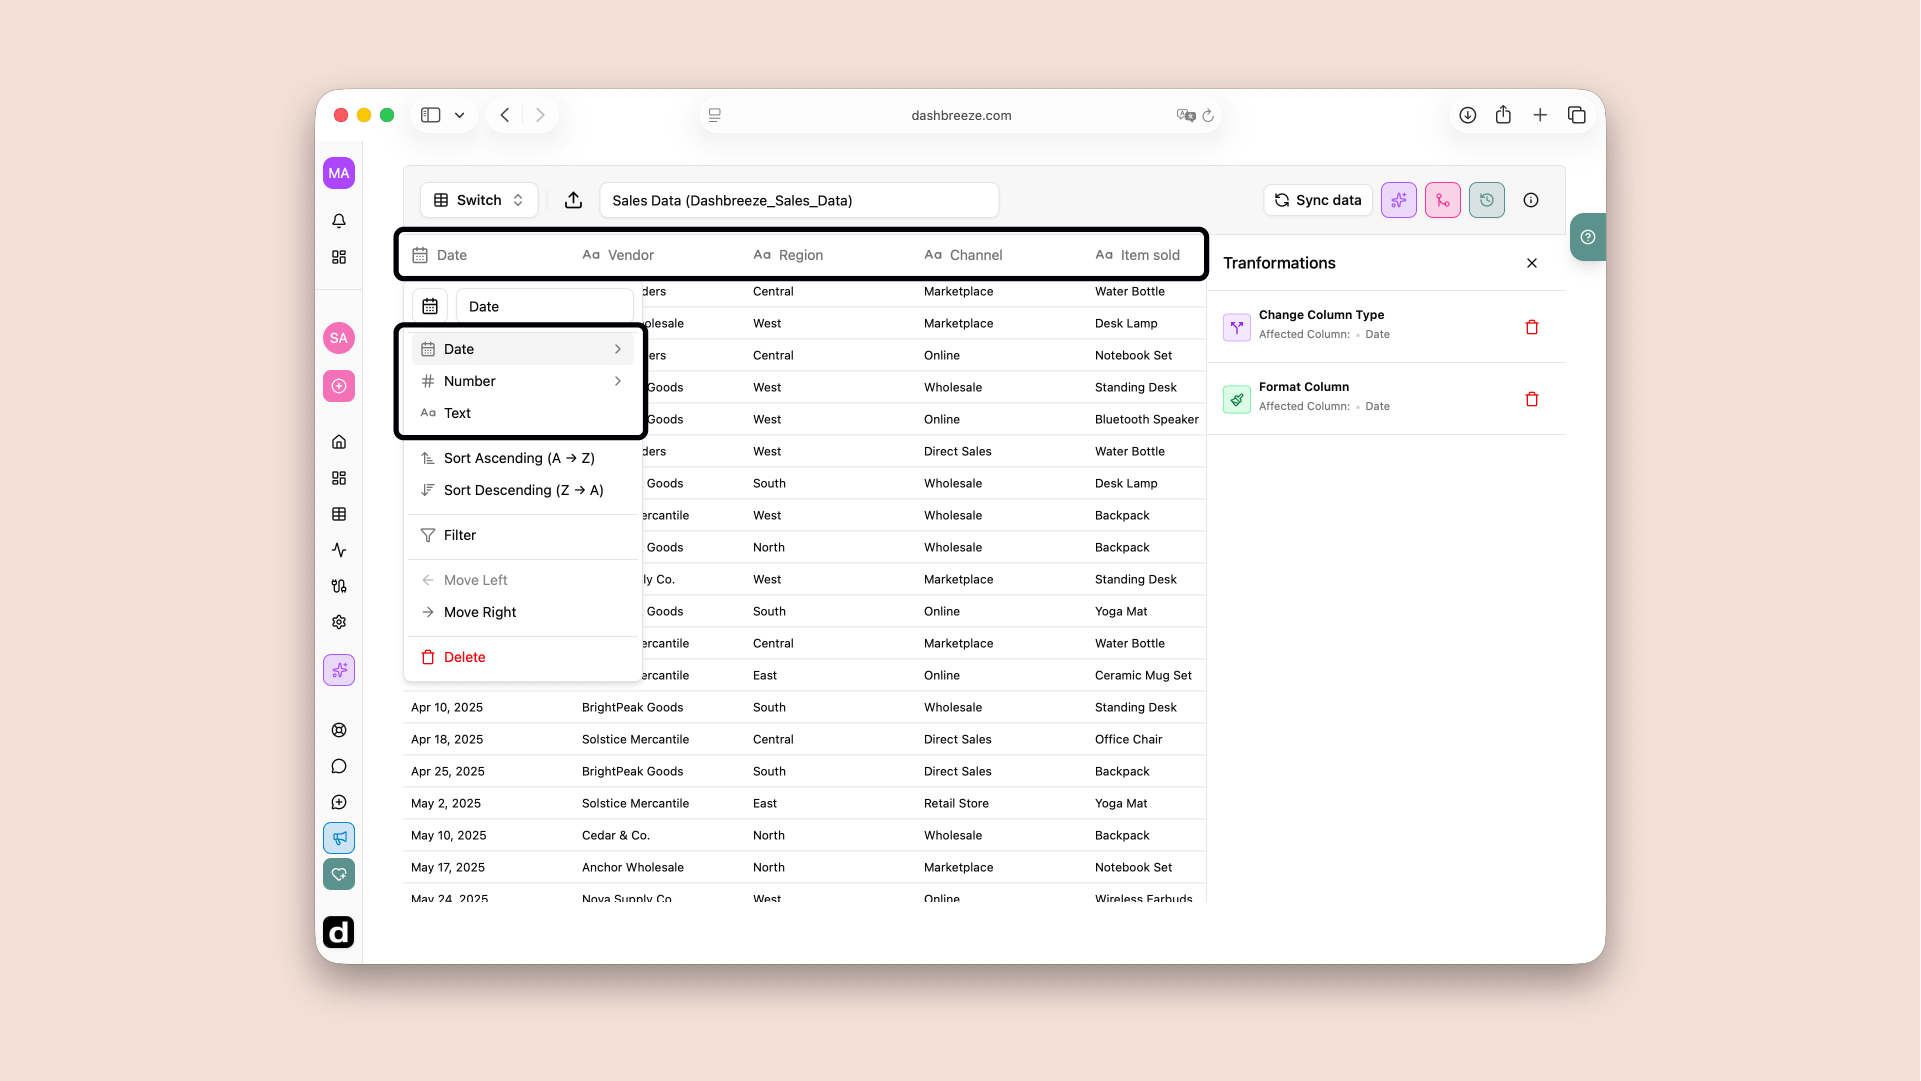
Changing a type can affect your dashboards:Changing a type converts the column's values. A value that cannot be converted may appear empty, and a connected block will show an error when its configuration is incompatible with the new type. For example, a KPI cannot sum a column changed from Number to Text.
Select a Date column to choose how its values appear. Formatting does not change the stored date, so sorting and date filters continue to use the same point in time.
| Display option | Example | Useful for |
|---|---|---|
| Year | 2026 | Yearly summaries |
| Month and year | August, 2026 | Monthly reporting |
| Numeric date | 08/25/2026 or 25/08/2026 | Regional date conventions |
| Written date | Aug 25, 2026 | Easy-to-read labels |
| ISO date | 2026-08-25 | Consistent technical reports |
| Date and time | Aug 25, 2026, 10:30 AM | Events and timestamps |
Number formatting changes how a numeric value is presented. The original value remains available for calculations, sorting, filters, charts, KPIs, and gauges.
Default number
Display a plain number and choose its decimal places, such as 1,250 or 1,250.00.
Percentage
Display a fraction as a percentage. For example, 0.256 appears as 25.6% with one decimal place.
Currency
Select a currency and decimal places. For example, 1250 can appear as $1,250.00 when USD is selected.
Custom
Add a prefix or suffix. For example, use a # prefix for rankings or a " units" suffix for quantities.
| Type | What you can do with it |
|---|---|
| Text | Group records into categories, label chart axes, and filter by matching text values. |
| Number | Sum, average, count, compare, and display values in KPIs, gauges, and chart measures. |
| Date | Sort chronologically and filter by fixed or rolling periods such as this month or the trailing 30 days. |
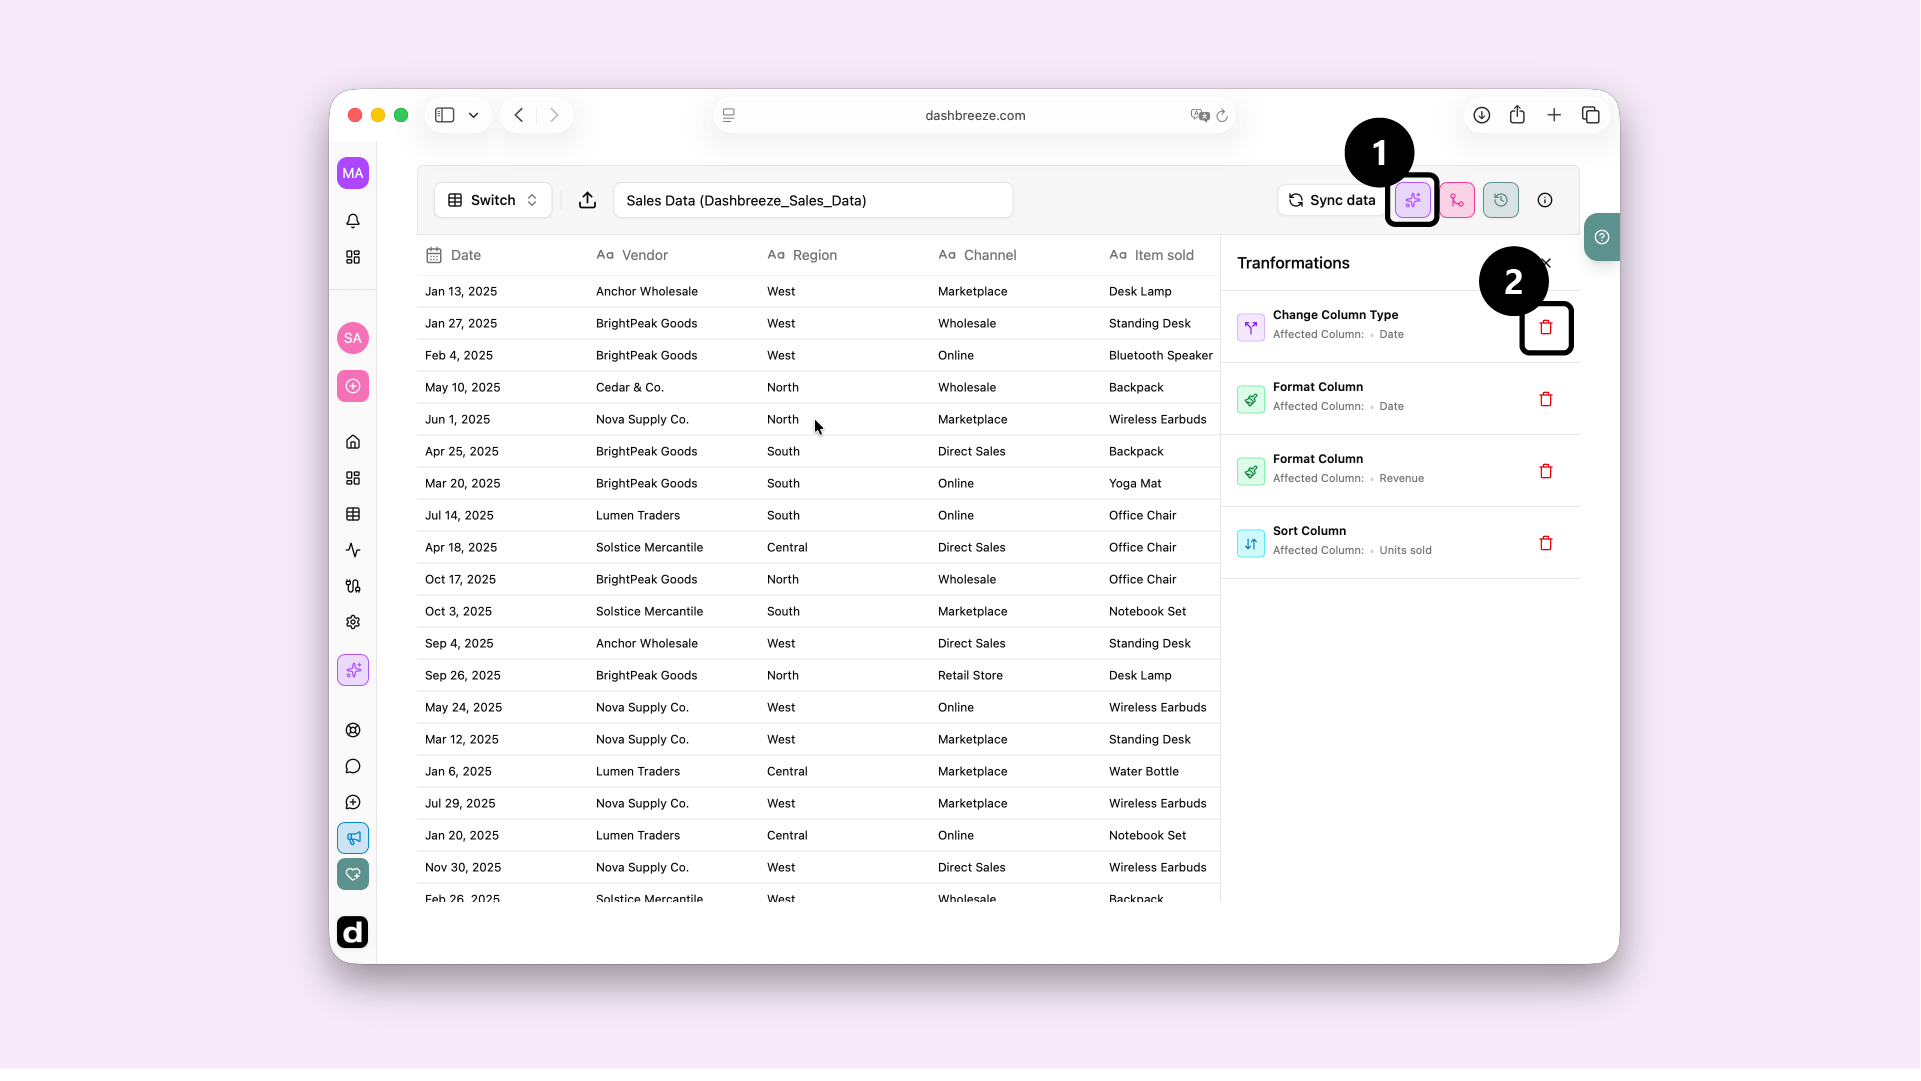
Every type or format change is saved as a step in the Transformations panel. To undo one, open that panel, find the relevant Change Column Type or Format Column step, and select its delete button. Dashbreeze then returns the column to the type or format produced by the earlier steps.
Check the steps that come after it:Transformations run in order. Removing a type change can affect later filters, calculations, and connected dashboard blocks that expect that type. Review the table and its dashboards after deleting the step.