

Column Types & Formatting
Set each column's type and choose how dates, numbers, and currency are displayed.

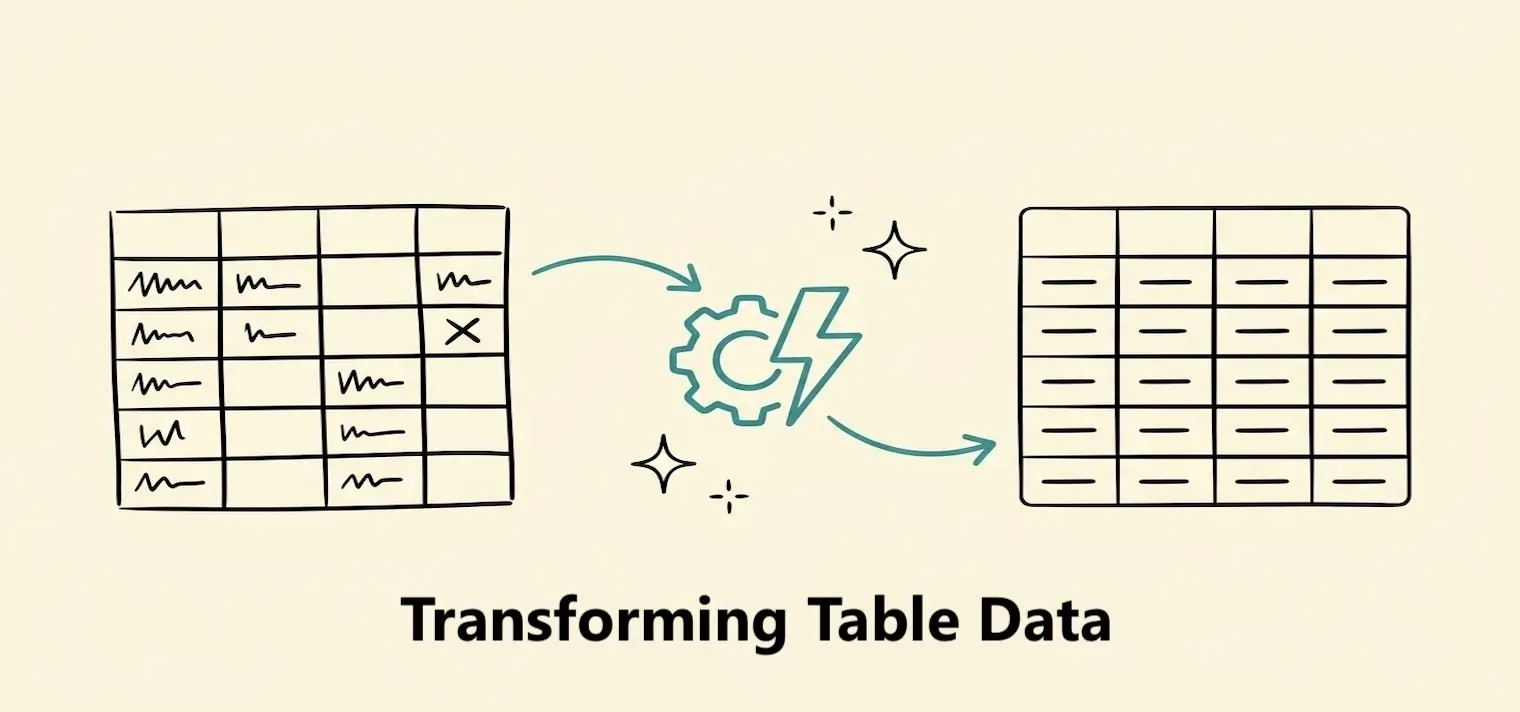
Transformations help you turn imported data into the exact shape your dashboard needs. You can clean up rows, rename and format columns, focus on relevant records, calculate new values, or add information from another table—without changing the original source.
Open Tables and select a table to enter the transformation editor. Most changes start from a column header; joins and table-wide controls are available in the editor toolbar.
Clean up rows and columns
Remove empty rows and columns, then delete anything your dashboard does not need.
Edit columns
Give columns clearer names, move them into a useful order, correct their types, and format their values.
Calculate values
Create a new column with a formula, or use a formula to replace the values in an existing column.
Filter rows
Keep only the records you want to analyze, including dynamic periods such as the trailing 30 days.
Sort rows
Arrange records by text, number, or date in ascending or descending order.
Join another table
Add related information from another table by matching a shared column. See Joining Tables.
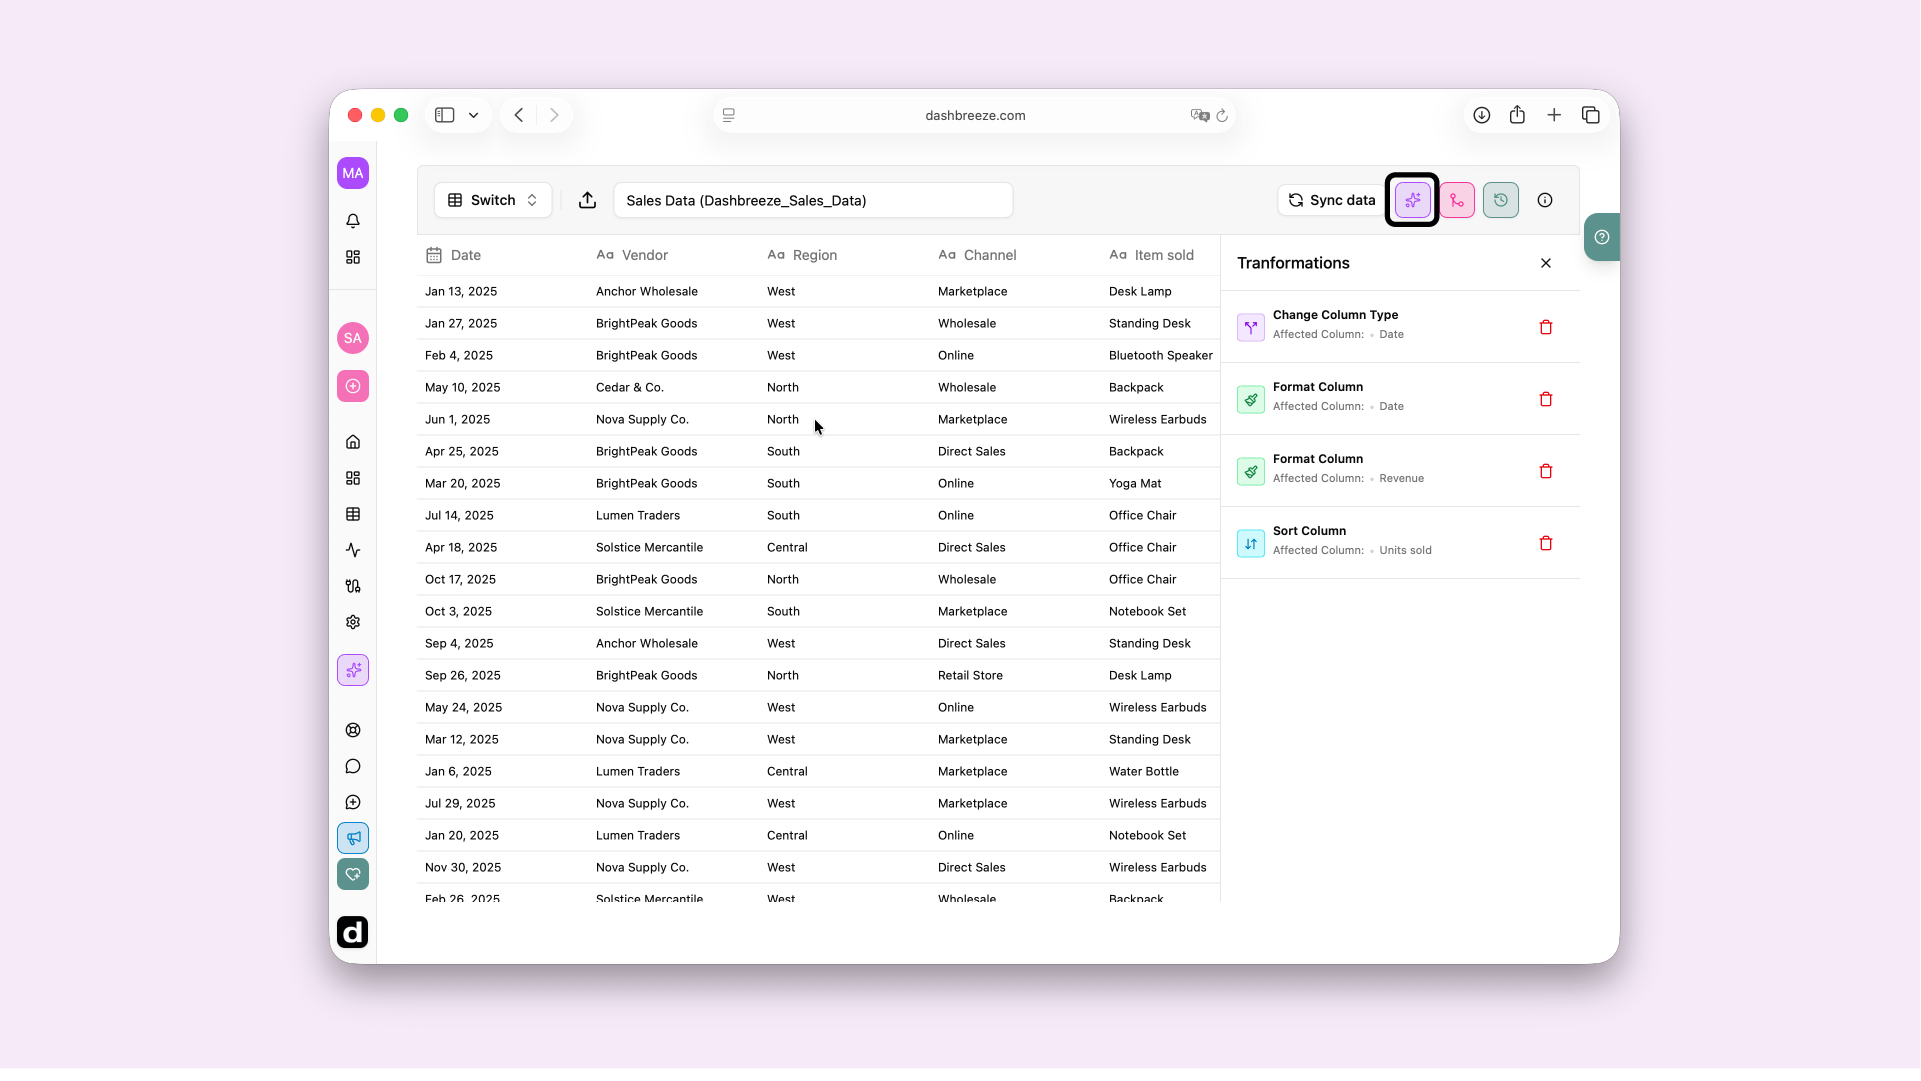
Every change becomes a step in the table's transformation pipeline. Dashbreeze runs the steps from top to bottom, so each step works with the result of the steps before it. Open the Transformations panel to review the sequence or remove a step you no longer need.
Renaming a column only changes the label shown in Dashbreeze. Existing transformations and connected blocks continue using the same column.
Transformations are reapplied after every refresh:When a table is refreshed with the latest source data, Dashbreeze automatically runs all of its saved transformations again, in the same order. You do not need to recreate or manually reapply them.
Your source data stays unchanged:Transformations only change the version of the data used inside Dashbreeze. They never edit your original file, spreadsheet, connected app, or database.
A dashboard block does not read the untouched source data. It reads the table after Dashbreeze has applied its transformations. When that result changes, every connected block receives the new result.
1. Imported data
120 orders
Includes completed, pending, and cancelled orders.
2. Transformation
Keep completed orders
A filter leaves 84 rows in the transformed table.
3. Dashboard result
Blocks use 84 orders
KPIs, charts, and table blocks exclude the other 36 rows.
| Transformation | Effect on connected blocks |
|---|---|
| Filter rows | Charts and table blocks show fewer records. KPI totals and averages are recalculated from the remaining rows. |
| Sort rows | Table blocks use the new row order. Calculated totals stay the same because no records were removed. |
| Format a column | Values appear in the selected date, number, percentage, or currency format; the underlying values stay the same. |
| Add or replace values | The calculated values can be selected in charts, KPIs, gauges, and table blocks. |
| Change a column type | A block will show an error when its configuration is not compatible with the new type. For example, a KPI cannot sum a column after it is changed from numeric to text. Reconfigure the block or restore a compatible type. |
| Join another table | Connected blocks can use the additional columns brought in from the joined table. |
| Rename a column | Connected blocks keep working. Only the label displayed on chart axes, legends, and table headers changes. |
| Remove a column | A block that uses the removed column will show an error until you reconfigure it to use an available column. |
Check connected dashboards:Transformations belong to the table, so their results are shared by every dashboard that uses it. After removing a column or changing its type, check the connected dashboards to make sure their block settings are still valid.