
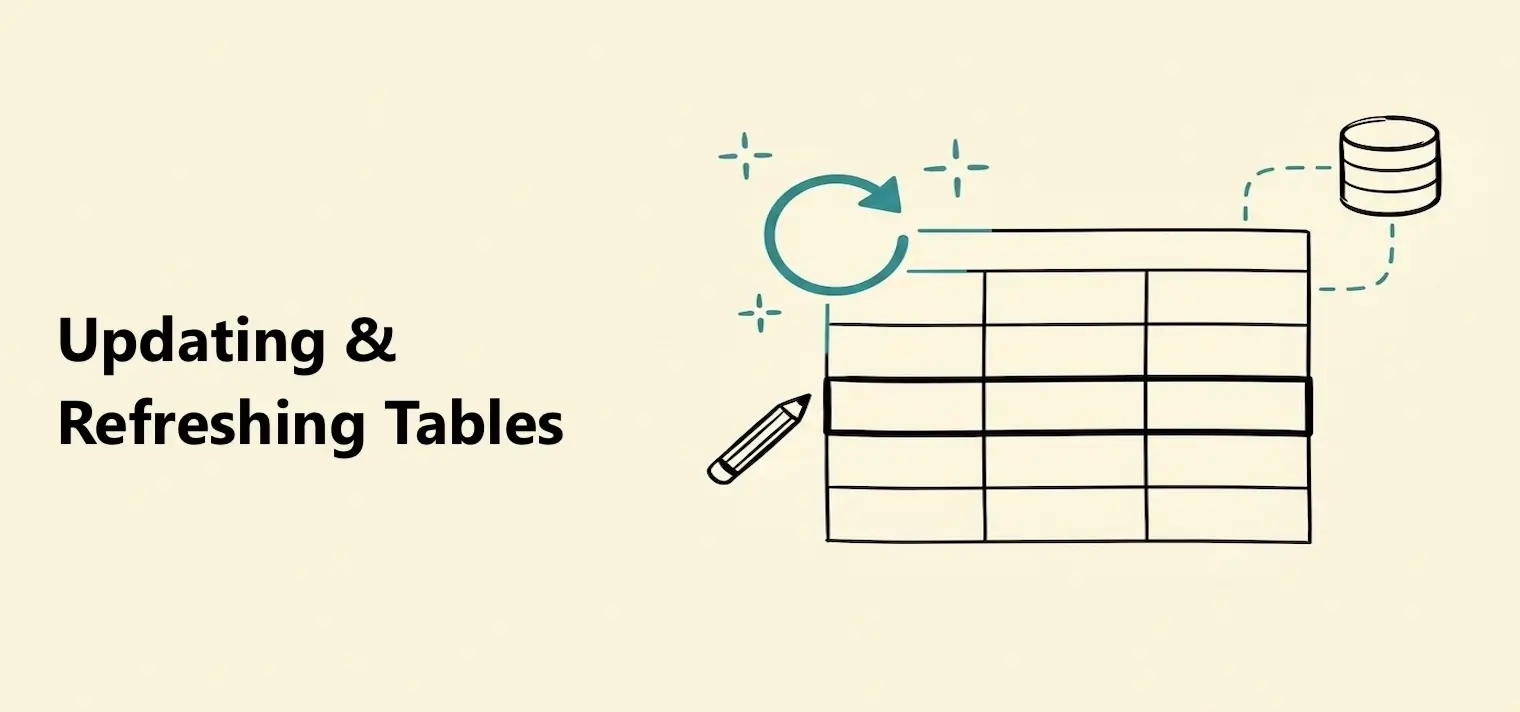
Updating & Refreshing Tables
Refresh a table manually or turn on automatic updates to keep its data current.

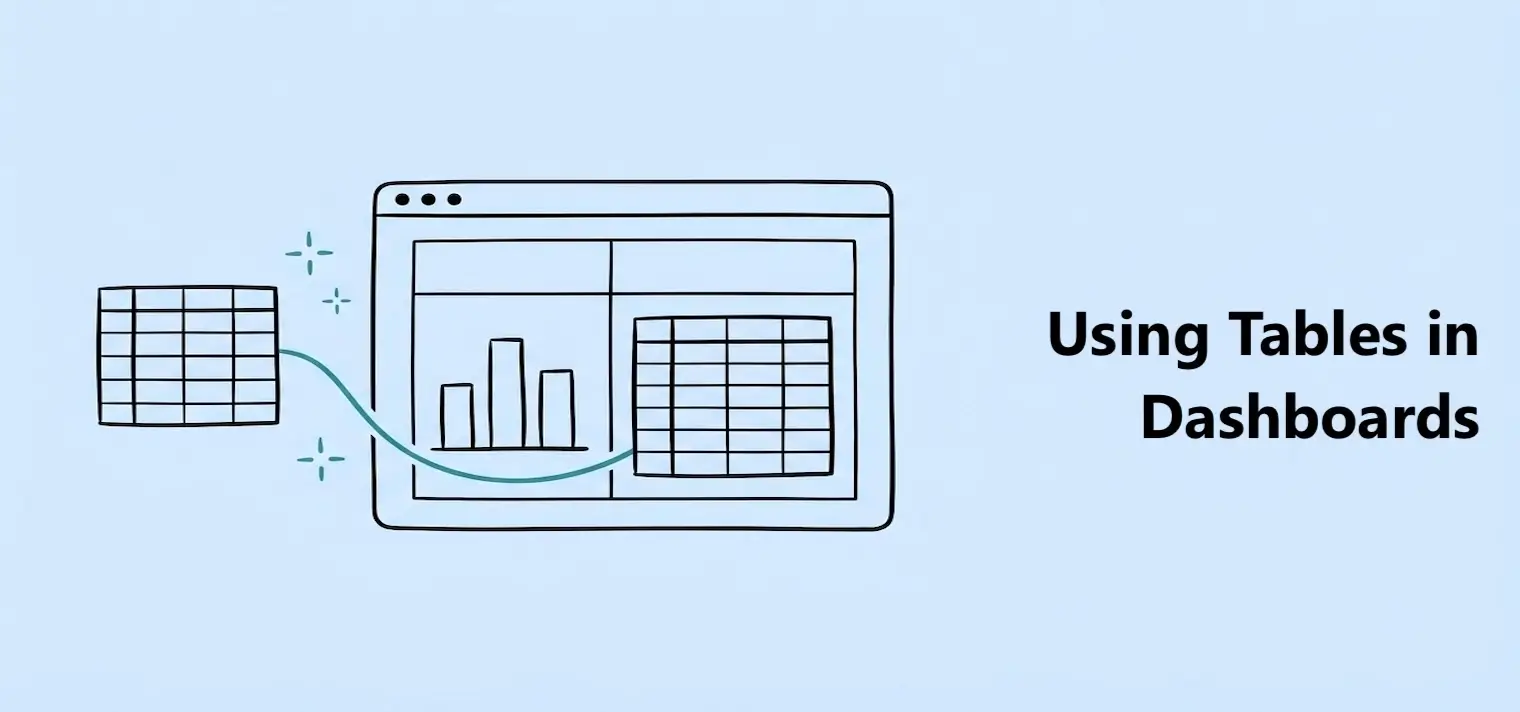
Tables hold the data used by your dashboards. Blocks turn that data into charts, totals, gauges, and lists of rows.
First, connect a table to a block. Then choose the columns and calculations the block should use. One table can be connected to many blocks.
Cannot find the table?:You can create a table without leaving the dashboard. Open Select Table, then choose Create Table and follow the steps to import your data.
Different blocks answer different questions. Choose the one that best fits what you want to show.
Chart
Compare values, show a trend, or see how a total is divided into groups.
Example: revenue by month.
KPI
Show one important number.
Example: total revenue.
Gauge
Show progress toward a target.
Example: 80% of the sales goal.
Table block
Show individual rows and selected columns.
Example: recent orders and their status.
The same table can power many blocks. Those blocks can be on one dashboard or on different dashboards. Each block can use different columns and calculations.
Shared table
Orders
Dates, customers, status, and revenue
| Table change | What happens to connected blocks |
|---|---|
| The table refreshes | Blocks receive the latest rows. Charts and totals update. |
| Rows are filtered | Every block uses only the rows left by the table filter. |
| A column is renamed | The block keeps working. It shows the new column label. |
| A column is removed or its type changes | A block that needs that column or type may show an error. Reconfigure the block. |
| The table is deleted | Blocks can no longer load data from it. |
Check connected dashboards first:Before removing a column, changing its type, or deleting a table, check every dashboard that uses it. You may need to update its blocks.
Both filters remove rows before a block calculates or displays data. The difference is how many blocks they affect.
Affects every connected block
Table filter
Add it while transforming the table. The filtered result is shared by every dashboard that uses that table.
Orders: keep Paid rows
Chart + KPI + Gauge + Table block
Use it when every block should always use the same smaller set of rows.
Affects one block
Block filter
Add it in one block's Data settings. Other blocks can still use all rows from the same table.
Revenue chart: keep Paid rows
Revenue chart only
Use it when one block needs a fixed condition that other blocks do not need.
A quick way to choose:Use a table filter when every connected block should use the filtered rows. Use a block filter when only one block needs the filter. If you use both, the table filter runs first. The block filter cannot bring back rows removed by the table filter.